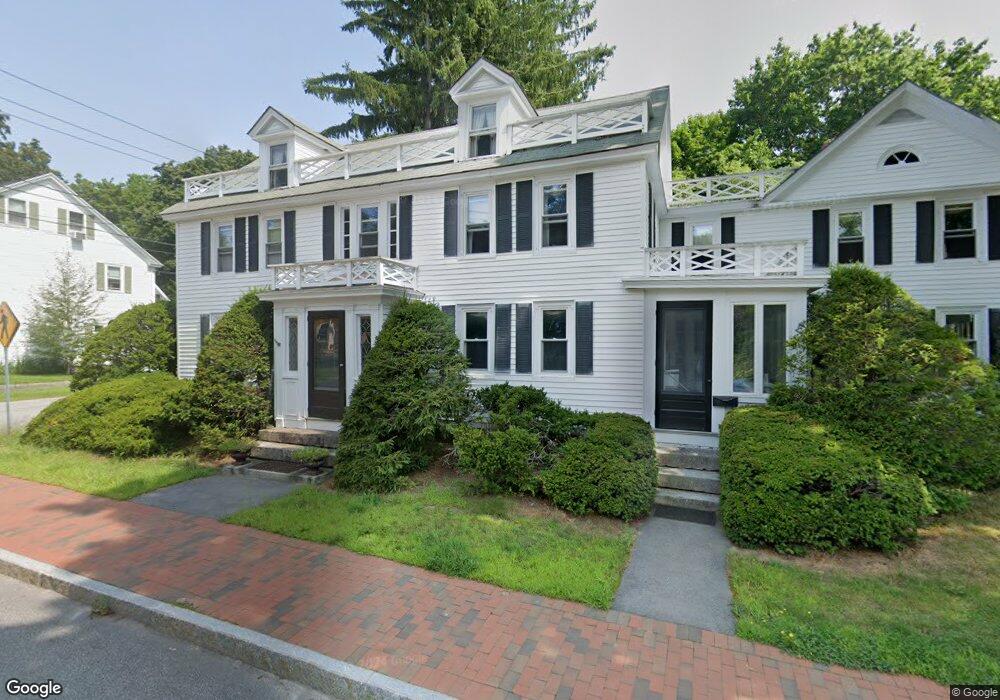
18 Dane St Kennebunk, ME 04043
Estimated Value: $898,000 - $1,117,000
4
Beds
3
Baths
3,256
Sq Ft
$312/Sq Ft
Est. Value
About This Home
This home is located at 18 Dane St, Kennebunk, ME 04043 and is currently estimated at $1,014,482, approximately $311 per square foot. 18 Dane St is a home located in York County with nearby schools including Kennebunk High School, School Around Us, and The New School.
Ownership History
Date
Name
Owned For
Owner Type
Purchase Details
Closed on
Aug 16, 2010
Sold by
Thompson Cynthia J and Thompson Stephen P
Bought by
Vanhemel Mary E and Vanhemel Peter J
Current Estimated Value
Home Financials for this Owner
Home Financials are based on the most recent Mortgage that was taken out on this home.
Original Mortgage
$400,000
Outstanding Balance
$258,325
Interest Rate
4.63%
Mortgage Type
Unknown
Estimated Equity
$756,157
Create a Home Valuation Report for This Property
The Home Valuation Report is an in-depth analysis detailing your home's value as well as a comparison with similar homes in the area
Home Values in the Area
Average Home Value in this Area
Purchase History
| Date | Buyer | Sale Price | Title Company |
|---|---|---|---|
| Vanhemel Mary E | -- | -- |
Source: Public Records
Mortgage History
| Date | Status | Borrower | Loan Amount |
|---|---|---|---|
| Open | Vanhemel Mary E | $400,000 | |
| Previous Owner | Vanhemel Mary E | $260,000 |
Source: Public Records
Tax History
| Year | Tax Paid | Tax Assessment Tax Assessment Total Assessment is a certain percentage of the fair market value that is determined by local assessors to be the total taxable value of land and additions on the property. | Land | Improvement |
|---|---|---|---|---|
| 2025 | $7,584 | $769,900 | $205,800 | $564,100 |
| 2024 | $7,344 | $433,300 | $71,100 | $362,200 |
| 2023 | $6,954 | $433,300 | $71,100 | $362,200 |
| 2022 | $6,326 | $433,300 | $71,100 | $362,200 |
| 2021 | $6,175 | $433,300 | $71,100 | $362,200 |
| 2020 | $6,131 | $433,300 | $71,100 | $362,200 |
| 2019 | $5,958 | $433,300 | $71,100 | $362,200 |
| 2018 | $0 | $324,400 | $53,300 | $271,100 |
| 2017 | $5,369 | $324,400 | $53,300 | $271,100 |
| 2016 | $0 | $324,400 | $53,300 | $271,100 |
| 2015 | $4,963 | $324,400 | $53,300 | $271,100 |
| 2014 | $4,834 | $324,400 | $53,300 | $271,100 |
Source: Public Records
Map
Nearby Homes
- 9 Summer St
- 14 Summer St Unit 6
- 93 Main St Unit A
- 24 Grove St Unit 24
- 10 Longview Terrace
- 30 York St Unit 1
- 61 Fletcher St
- 60 Brown St Unit 17
- 15 Casey Ln
- 23 Chamberlain Way Unit 23
- 1 Hall St
- 24 Cat Mousam Rd
- 3 Hardwood Ln
- 20 Wonderbrook Dr
- 22 Oakwood Ln
- 20 Landing Dr Unit 20
- 32 Landing Dr Unit 32
- 17 Webhannet Place Unit 11
- 10 Webhannet Place Unit 1
- 15 Webhannet Place Unit 10
Your Personal Tour Guide
Ask me questions while you tour the home.