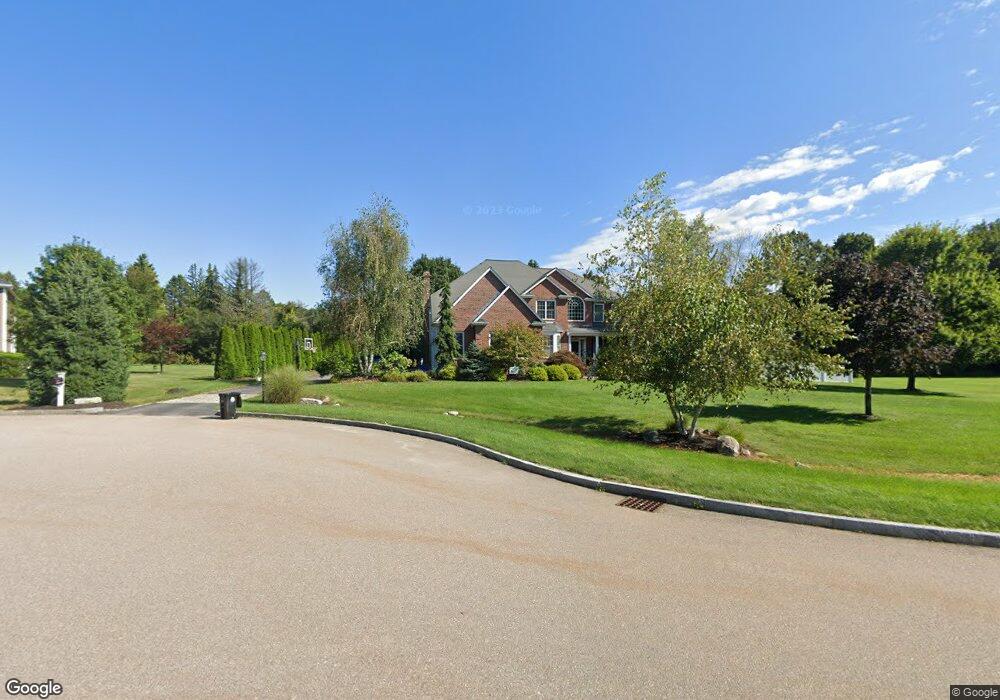
18 Gibbons Ln Wrentham, MA 02093
Estimated Value: $1,030,000 - $1,410,000
3
Beds
3
Baths
3,634
Sq Ft
$327/Sq Ft
Est. Value
About This Home
This home is located at 18 Gibbons Ln, Wrentham, MA 02093 and is currently estimated at $1,186,576, approximately $326 per square foot. 18 Gibbons Ln is a home located in Norfolk County with nearby schools including Delaney Elementary School and Charles E Roderick.
Ownership History
Date
Name
Owned For
Owner Type
Purchase Details
Closed on
Dec 26, 2007
Sold by
Overcliff Rt
Bought by
Whalen Kim M and Whalen Scott
Current Estimated Value
Purchase Details
Closed on
Jun 1, 2006
Sold by
Bowmar Ests Llc
Bought by
Overcliff Rt
Home Financials for this Owner
Home Financials are based on the most recent Mortgage that was taken out on this home.
Original Mortgage
$400,000
Interest Rate
6.55%
Mortgage Type
Purchase Money Mortgage
Create a Home Valuation Report for This Property
The Home Valuation Report is an in-depth analysis detailing your home's value as well as a comparison with similar homes in the area
Purchase History
| Date | Buyer | Sale Price | Title Company |
|---|---|---|---|
| Whalen Kim M | -- | -- | |
| Overcliff Rt | $500,000 | -- |
Source: Public Records
Mortgage History
| Date | Status | Borrower | Loan Amount |
|---|---|---|---|
| Previous Owner | Overcliff Rt | $400,000 |
Source: Public Records
Tax History
| Year | Tax Paid | Tax Assessment Tax Assessment Total Assessment is a certain percentage of the fair market value that is determined by local assessors to be the total taxable value of land and additions on the property. | Land | Improvement |
|---|---|---|---|---|
| 2025 | $12,573 | $1,084,800 | $327,300 | $757,500 |
| 2024 | $11,935 | $994,600 | $327,300 | $667,300 |
| 2023 | $12,043 | $954,300 | $297,600 | $656,700 |
| 2022 | $11,473 | $839,300 | $270,700 | $568,600 |
| 2021 | $11,188 | $795,200 | $270,700 | $524,500 |
| 2020 | $10,688 | $750,000 | $222,500 | $527,500 |
| 2019 | $10,238 | $725,100 | $222,500 | $502,600 |
| 2018 | $9,437 | $662,700 | $222,700 | $440,000 |
| 2017 | $9,200 | $645,600 | $218,400 | $427,200 |
| 2016 | $9,075 | $635,500 | $212,100 | $423,400 |
| 2015 | $9,261 | $618,200 | $203,900 | $414,300 |
| 2014 | $8,860 | $578,700 | $196,100 | $382,600 |
Source: Public Records
Map
Nearby Homes
- 10 Earle Stewart Ln Unit Lot 5
- 12 Earle Stewart Ln
- 2 Earle Stewart Ln
- 3 Earle Stewart Ln
- 215 South St
- 10 Nature View Dr
- 15 Nature View Dr
- 500 Franklin St
- 15 Tilting Rock Rd
- 54 Elysium St
- 30 Partridge View Ln S
- 151 Dedham St
- 440 Chestnut St
- 165 Wampum St
- 1204 South St
- 1222 South St
- 613 West St
- 282 Thurston St
- 23 Horseshoe Dr
- 35 Fairbanks Dr
Your Personal Tour Guide
Ask me questions while you tour the home.