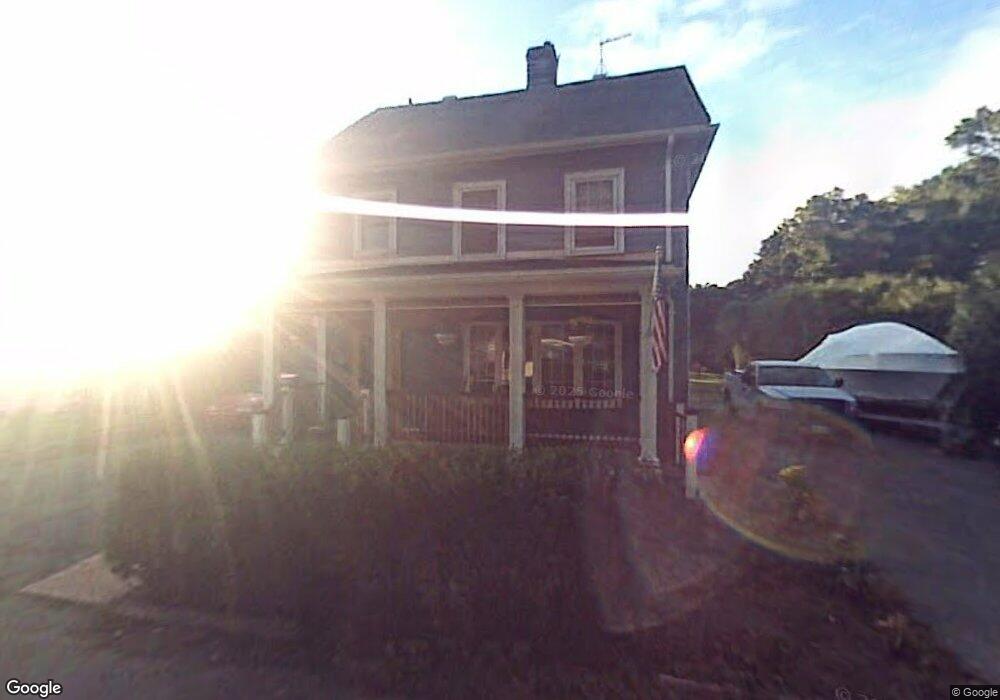
18 Glancy Ln Dedham, MA 02026
East Dedham NeighborhoodEstimated Value: $661,000 - $767,000
3
Beds
2
Baths
1,530
Sq Ft
$468/Sq Ft
Est. Value
About This Home
This home is located at 18 Glancy Ln, Dedham, MA 02026 and is currently estimated at $716,238, approximately $468 per square foot. 18 Glancy Ln is a home located in Norfolk County with nearby schools including Avery, Dedham Middle School, and Dedham High School.
Ownership History
Date
Name
Owned For
Owner Type
Purchase Details
Closed on
Dec 24, 1996
Sold by
Richmond Lawrence F and Richmond Marie E
Bought by
Richmond Francis G
Current Estimated Value
Home Financials for this Owner
Home Financials are based on the most recent Mortgage that was taken out on this home.
Original Mortgage
$100,000
Interest Rate
7.62%
Mortgage Type
Purchase Money Mortgage
Create a Home Valuation Report for This Property
The Home Valuation Report is an in-depth analysis detailing your home's value as well as a comparison with similar homes in the area
Home Values in the Area
Average Home Value in this Area
Purchase History
| Date | Buyer | Sale Price | Title Company |
|---|---|---|---|
| Richmond Francis G | $130,000 | -- |
Source: Public Records
Mortgage History
| Date | Status | Borrower | Loan Amount |
|---|---|---|---|
| Open | Richmond Francis G | $268,000 | |
| Closed | Richmond Francis G | $200,000 | |
| Closed | Richmond Francis G | $100,000 |
Source: Public Records
Tax History
| Year | Tax Paid | Tax Assessment Tax Assessment Total Assessment is a certain percentage of the fair market value that is determined by local assessors to be the total taxable value of land and additions on the property. | Land | Improvement |
|---|---|---|---|---|
| 2025 | $8,293 | $657,100 | $292,300 | $364,800 |
| 2024 | $8,149 | $651,900 | $276,700 | $375,200 |
| 2023 | $7,312 | $569,500 | $245,700 | $323,800 |
| 2022 | $6,990 | $523,600 | $240,700 | $282,900 |
| 2021 | $6,657 | $487,000 | $235,400 | $251,600 |
| 2020 | $6,498 | $473,600 | $225,100 | $248,500 |
| 2019 | $6,058 | $428,100 | $195,800 | $232,300 |
| 2018 | $5,920 | $406,900 | $174,600 | $232,300 |
| 2017 | $5,669 | $384,100 | $164,800 | $219,300 |
| 2016 | $6,036 | $389,700 | $143,900 | $245,800 |
| 2015 | $5,770 | $363,600 | $139,800 | $223,800 |
| 2014 | $5,601 | $348,300 | $136,700 | $211,600 |
Source: Public Records
Map
Nearby Homes
- 109 Rockland St
- 94 Rockland St
- 22 Greenhood St Unit 22
- 49 Greenhood St
- 153 Colburn St
- 25 Rockland St Unit 5
- 187 Colburn St Unit 187
- 54 Waldo St
- 11 Stimson St
- 132 Whitehall St
- 285 Colburn St
- 5257 Washington St Unit 2
- 8 Sumner St
- 5245 Washington St Unit 5
- 21 Chauncey St
- 19 Lewis Ln
- 231 Grove St
- 108 High St
- 90 High St Unit 309
- 231-245 Grove St
- 14 Glancy Ln
- 22 Glancy Ln
- 13 Glancy Ln
- 10 Glancy Ln
- 3 Glancy Ln
- 121 Rockland St Unit 2
- 121 Rockland St Unit 3
- 121 Rockland St
- 121 Rockland St Unit 1
- 4 Glancy Ln
- 29 Glancy Ln
- 47 Bussey St
- 14 Train Ln
- 31 Bussey St
- 115 Rockland St
- 61 Bussey St
- 59 Bussey St
- 124 Rockland St Unit 1
- 32 Bussey St
- 44 Bussey St
Your Personal Tour Guide
Ask me questions while you tour the home.