Estimated Value: $393,000 - $622,000
Studio
--
Bath
1,144
Sq Ft
$411/Sq Ft
Est. Value
About This Home
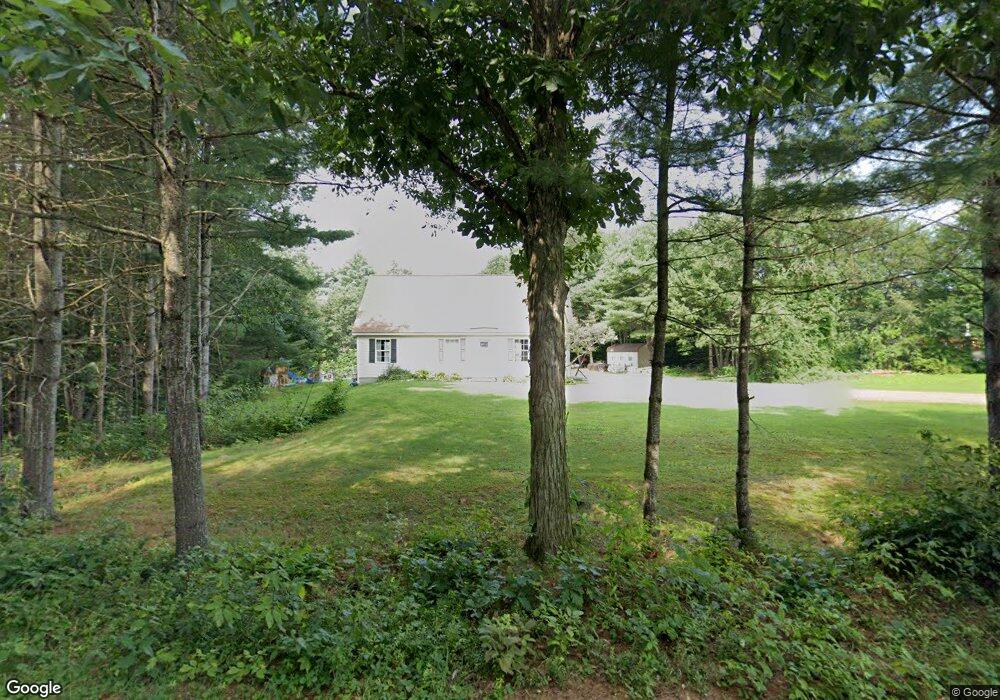
This home is located at 18 Hopper Rd, Acton, ME 04001 and is currently estimated at $470,182, approximately $410 per square foot. 18 Hopper Rd is a home located in York County with nearby schools including Acton Elementary School.
Ownership History
Date
Name
Owned For
Owner Type
Purchase Details
Closed on
Dec 4, 2020
Sold by
Waitt Daniel M
Bought by
Beattie Jonathan A and Wears Jessica L
Current Estimated Value
Home Financials for this Owner
Home Financials are based on the most recent Mortgage that was taken out on this home.
Original Mortgage
$220,400
Outstanding Balance
$194,778
Interest Rate
2.8%
Mortgage Type
New Conventional
Estimated Equity
$275,404
Purchase Details
Closed on
Sep 1, 2009
Sold by
Farrell Annette
Bought by
Waitt Daniel M
Home Financials for this Owner
Home Financials are based on the most recent Mortgage that was taken out on this home.
Original Mortgage
$169,375
Interest Rate
5.17%
Mortgage Type
FHA
Create a Home Valuation Report for This Property
The Home Valuation Report is an in-depth analysis detailing your home's value as well as a comparison with similar homes in the area
Home Values in the Area
Average Home Value in this Area
Purchase History
| Date | Buyer | Sale Price | Title Company |
|---|---|---|---|
| Beattie Jonathan A | -- | None Available | |
| Waitt Daniel M | -- | -- |
Source: Public Records
Mortgage History
| Date | Status | Borrower | Loan Amount |
|---|---|---|---|
| Open | Beattie Jonathan A | $220,400 | |
| Previous Owner | Waitt Daniel M | $169,375 |
Source: Public Records
Tax History
| Year | Tax Paid | Tax Assessment Tax Assessment Total Assessment is a certain percentage of the fair market value that is determined by local assessors to be the total taxable value of land and additions on the property. | Land | Improvement |
|---|---|---|---|---|
| 2025 | $2,150 | $298,201 | $96,540 | $201,661 |
| 2024 | $2,108 | $298,201 | $96,540 | $201,661 |
| 2023 | $1,923 | $298,201 | $96,540 | $201,661 |
| 2022 | $2,307 | $193,024 | $45,954 | $147,070 |
| 2021 | $2,307 | $193,024 | $45,954 | $147,070 |
| 2020 | $2,326 | $193,024 | $45,954 | $147,070 |
| 2019 | $2,326 | $193,024 | $45,954 | $147,070 |
| 2018 | $2,326 | $193,024 | $45,954 | $147,070 |
| 2017 | $2,297 | $193,024 | $45,954 | $147,070 |
| 2016 | $2,172 | $193,024 | $45,954 | $147,070 |
| 2015 | $2,229 | $193,024 | $45,954 | $147,070 |
| 2014 | $2,143 | $193,023 | $45,954 | $147,069 |
Source: Public Records
Map
Nearby Homes
- 182 Hopper Rd
- 189 Hopper Rd
- 303 Sam Page Rd
- 224-3-1 Maine 109
- 450 Sanborn Rd
- 2620 Maine 109
- 57 Plantation Way
- 46 Plantation Way
- TBD Hopper
- 177 Hussey Hill Rd
- Lot 11 Ridge Way
- Lot 13 Ridge Way
- 155 14th St
- 55 Loop Rd
- 117 Middle Rd
- 196 Loop Rd
- 95 Loop Rd
- 59 Treasure Island Rd
- 1498 W Shore Dr
- 100 Warden's Way
Your Personal Tour Guide
Ask me questions while you tour the home.