18 Larned Rd Oxford, MA 01540
Estimated Value: $611,000 - $823,000
About This Home
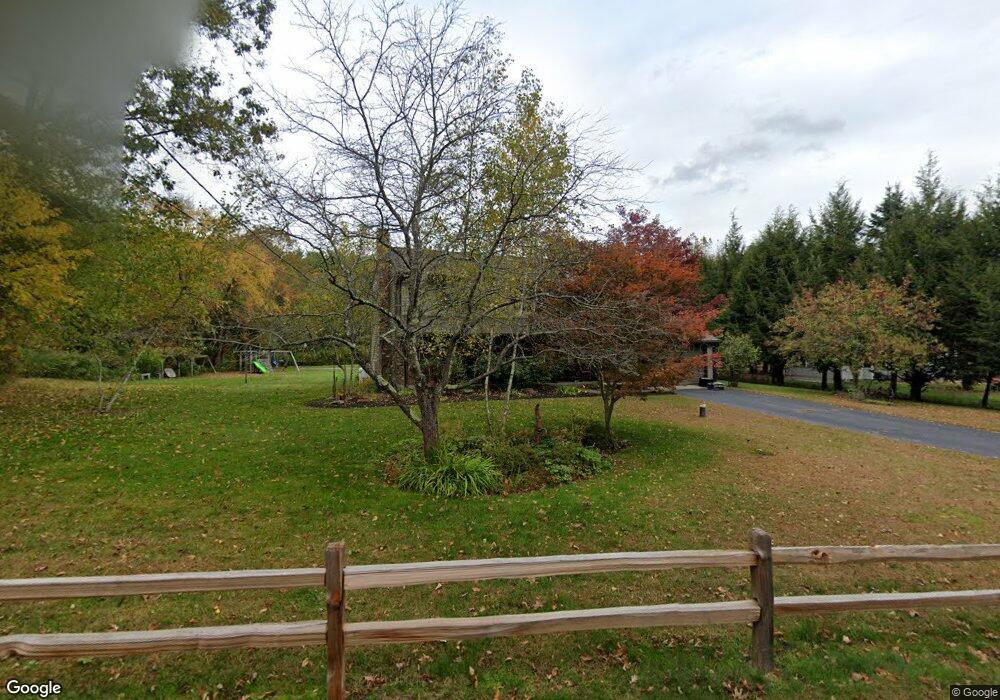
This home is located at 18 Larned Rd, Oxford, MA 01540 and is currently estimated at $675,516, approximately $303 per square foot. 18 Larned Rd is a home located in Worcester County with nearby schools including Alfred M Chaffee, Oxford High School, and Clara Barton Elementary School.
Ownership History
We collect this data history from publicly available records. To have your information removed, we recommend requesting removal directly through your county’s website.
Purchase Details
Home Values in the Area
Average Home Value in this Area
Purchase History
We collect this data history from publicly available records. To have your information removed, we recommend requesting removal directly through your county’s website.
| Date | Buyer | Sale Price | Title Company |
|---|---|---|---|
| $249,900 | -- |
Mortgage History
We collect this data history from publicly available records. To have your information removed, we recommend requesting removal directly through your county’s website.
| Date | Status | Borrower | Loan Amount |
|---|---|---|---|
| Open | $169,000 | ||
| Closed | $100,000 | ||
| Closed | $50,000 |
Tax History
We collect this data history from publicly available records. To have your information removed, we recommend requesting removal directly through your county’s website.
| Year | Tax Paid | Tax Assessment Tax Assessment Total Assessment is a certain percentage of the fair market value that is determined by local assessors to be the total taxable value of land and additions on the property. | Land | Improvement |
|---|---|---|---|---|
| 2025 | $71 | $559,500 | $106,700 | $452,800 |
| 2024 | $6,942 | $515,000 | $99,000 | $416,000 |
| 2023 | $6,348 | $465,400 | $88,400 | $377,000 |
| 2022 | $6,071 | $375,700 | $69,300 | $306,400 |
| 2021 | $5,863 | $354,700 | $65,700 | $289,000 |
| 2020 | $5,654 | $339,400 | $65,700 | $273,700 |
| 2019 | $4,750 | $278,900 | $65,700 | $213,200 |
| 2018 | $4,502 | $260,700 | $65,700 | $195,000 |
| 2017 | $4,528 | $268,700 | $66,600 | $202,100 |
| 2016 | $4,549 | $268,700 | $66,600 | $202,100 |
| 2015 | $4,243 | $268,700 | $66,600 | $202,100 |
| 2014 | $4,173 | $278,200 | $66,600 | $211,600 |
Map
- 136 Dudley Rd
- 13 Harwood St
- 10 Patton St
- 3 Henry Marsh Rd Unit B
- 28 Sullivan Blvd Unit A
- 110A Main St
- 11 Friar Tuck Ln
- 12 Carron Ln
- 0 Old Southbridge Rd
- 5 Litchfield Ln Unit 5A
- 11 Riverside Dr
- 196 Old Webster Rd
- 12 Mckinstry Dr
- 39 Fairlawn Ave
- 23 Walnut St
- 6 Carol Dr
- 16 Lindsey Ln
- 3 Oakwood Dr
- 22 Quobaug Ave
- 58 Lelandville Rd
Ask me questions while you tour the home.