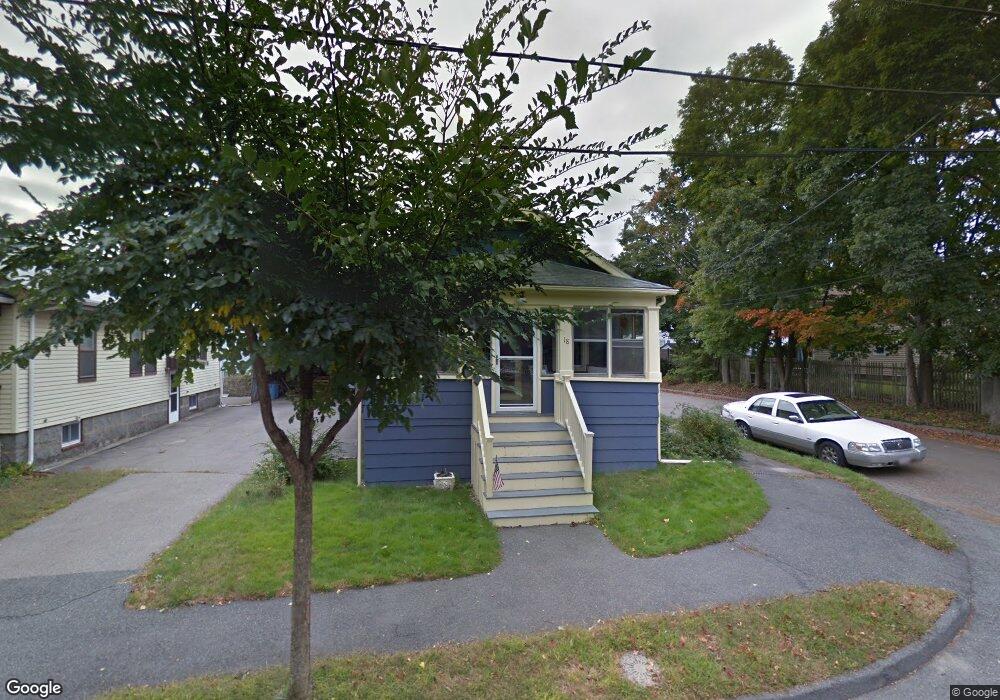
18 Lillian Rd Quincy, MA 02170
Quincy Center NeighborhoodEstimated Value: $534,000 - $637,000
2
Beds
1
Bath
924
Sq Ft
$610/Sq Ft
Est. Value
About This Home
This home is located at 18 Lillian Rd, Quincy, MA 02170 and is currently estimated at $563,789, approximately $610 per square foot. 18 Lillian Rd is a home located in Norfolk County with nearby schools including Charles A. Bernazzani Elementary School, Central Middle School, and North Quincy High School.
Ownership History
We collect this data history from publicly available records. To have your information removed, we recommend requesting removal directly through your county’s website.
Date
Name
Owned For
Owner Type
Purchase Details
Closed on
Apr 7, 1992
Sold by
Bought by
Current Estimated Value
Home Financials for this Owner
Home Financials are based on the most recent Mortgage that was taken out on this home.
Original Mortgage
$98,400
Interest Rate
8.73%
Mortgage Type
Purchase Money Mortgage
Purchase Details
Closed on
Dec 20, 1990
Sold by
Bought by
Home Financials for this Owner
Home Financials are based on the most recent Mortgage that was taken out on this home.
Original Mortgage
$123,900
Interest Rate
10.02%
Mortgage Type
Purchase Money Mortgage
Create a Home Valuation Report for This Property
The Home Valuation Report is an in-depth analysis detailing your home's value as well as a comparison with similar homes in the area
Home Values in the Area
Average Home Value in this Area
Map
Nearby Homes
- 45 Oval Rd Unit 34
- 45 Oval Rd Unit 8
- 999 Hancock St Unit 313
- 1025 Hancock St Unit 10C
- 1025 Hancock St Unit 4J
- 1025 Hancock St Unit 14F
- 1025 Hancock St Unit 2P
- 77 Adams St Unit 210
- 77 Adams St Unit 611
- 77 Adams St Unit 610
- 77 Adams St Unit 1102
- 87 Dewson Rd
- 128 Prospect Ave
- 1 Adams St Unit 401
- 44 Greenleaf St
- 148 Presidents Ln Unit 4
- 10 Edgemere Rd
- 111 Greenleaf St
- 165 Whitwell St
- 43 Dixwell Ave
- 16 Morgan Rd
- 12 Morgan Rd
- 12 Morgan Rd Unit 1
- 20 Morgan Rd
- 457 Furnace Brook Pkwy
- 10 Morgan Rd
- 453 Furnace Brook Pkwy
- 15 Morgan Rd
- 469 Furnace Brook Pkwy
- 11 Morgan Rd
- 449 Furnace Brook Pkwy
- 4 Morgan Rd
- 40 Morley Rd
- 615 Newport Ave
- 5 Morgan Rd
- 16 Lillian Rd
- 10 Lillian Rd
- 10 Lillian Rd Unit 2
- 1 Morgan Rd
- 36 Morley Rd
Your Personal Tour Guide
Ask me questions while you tour the home.