Estimated Value: $690,000 - $909,000
About This Home
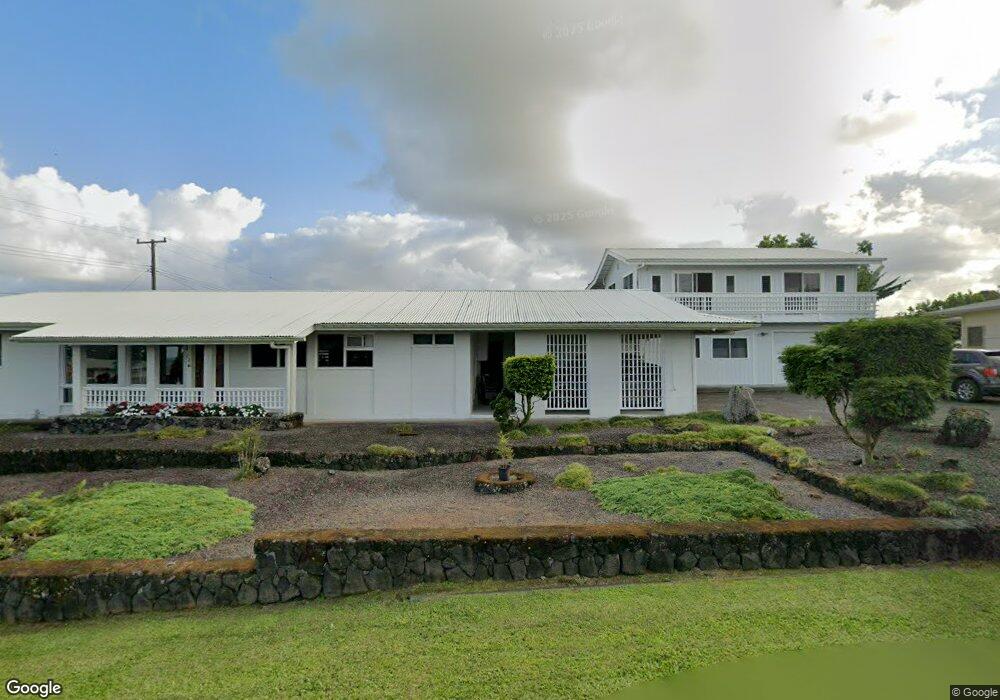
This home is located at 18 Moi St, Hilo, HI 96720 and is currently estimated at $789,561, approximately $271 per square foot. 18 Moi St is a home located in Hawaii County with nearby schools including Waiakeawaena Elementary School, Waiakea Intermediate School, and Waiakea High School.
Ownership History
We collect this data history from publicly available records. To have your information removed, we recommend requesting removal directly through your county’s website.
Purchase Details
Purchase Details
Purchase Details
Home Values in the Area
Average Home Value in this Area
Purchase History
We collect this data history from publicly available records. To have your information removed, we recommend requesting removal directly through your county’s website.
| Date | Buyer | Sale Price | Title Company |
|---|---|---|---|
| -- | None Listed On Document | ||
| -- | -- | ||
| -- | -- |
Tax History
We collect this data history from publicly available records. To have your information removed, we recommend requesting removal directly through your county’s website.
| Year | Tax Paid | Tax Assessment Tax Assessment Total Assessment is a certain percentage of the fair market value that is determined by local assessors to be the total taxable value of land and additions on the property. | Land | Improvement |
|---|---|---|---|---|
| 2026 | $1,871 | $555,700 | $86,000 | $469,700 |
| 2025 | $1,871 | $539,500 | $86,000 | $453,500 |
| 2024 | $1,778 | $523,800 | $86,000 | $437,800 |
| 2023 | $1,836 | $508,500 | $86,000 | $422,500 |
| 2022 | $1,929 | $493,700 | $86,000 | $407,700 |
| 2021 | $1,841 | $479,300 | $86,000 | $393,300 |
| 2020 | $1,755 | $465,300 | $86,000 | $379,300 |
| 2019 | $1,671 | $451,700 | $83,500 | $368,200 |
| 2018 | $1,590 | $438,500 | $83,500 | $355,000 |
| 2017 | $1,511 | $425,700 | $83,500 | $342,200 |
| 2016 | $1,435 | $413,300 | $83,500 | $329,800 |
| 2015 | $1,139 | $401,300 | $83,500 | $317,800 |
| 2014 | $1,139 | $389,600 | $73,400 | $316,200 |
Map
- 93 Akea St
- 752 Kaalo Place
- 250 Laula
- 508 Ekela St
- 350 Ka Manelo Place
- 39 Laula Rd
- 82 Malia St
- 317 Ainaola Dr
- 64 Leimamo St
- 54 Leimamo St
- 0 Ainalako Rd
- 0 Ainalako Rd Unit LOT 10, PARCEL A-6
- 91 Hoomalu St
- 450 Pohakulani St
- 491 Naniakea St
- 49 Waiakea Place
- 1556 Alu St
- 1316 Malawaina St
- 862 Hoolaulea St
- 0 Pohakulani St
Ask me questions while you tour the home.