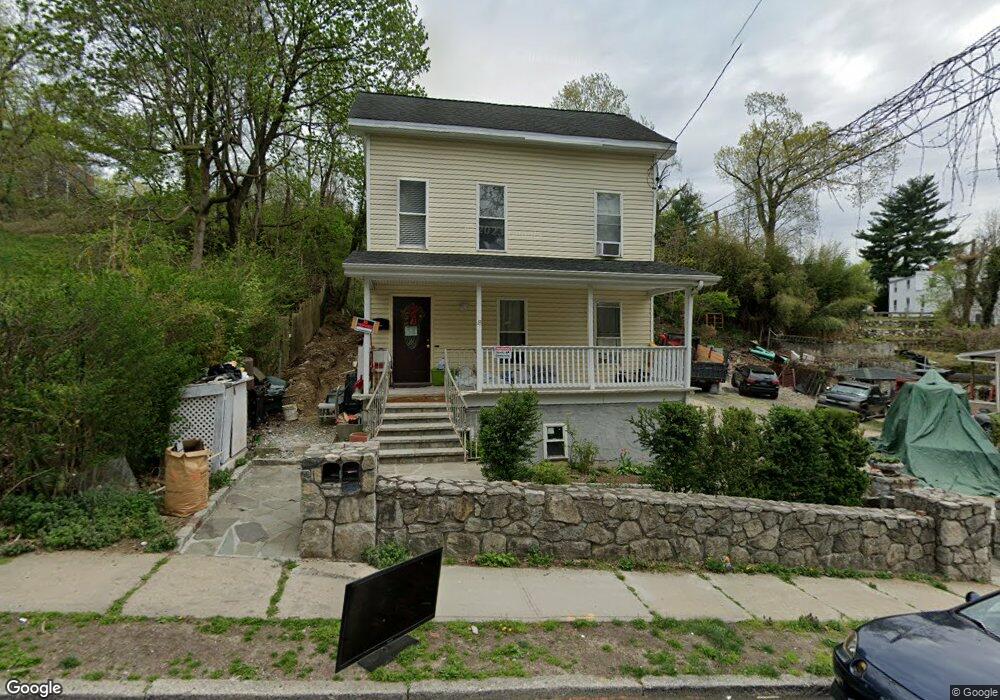
18 N Malcolm St Ossining, NY 10562
Estimated Value: $637,000 - $830,000
5
Beds
3
Baths
3,426
Sq Ft
$215/Sq Ft
Est. Value
About This Home
This home is located at 18 N Malcolm St, Ossining, NY 10562 and is currently estimated at $736,557, approximately $214 per square foot. 18 N Malcolm St is a home located in Westchester County with nearby schools including Park School, Claremont School, and Roosevelt Elementary School.
Ownership History
Date
Name
Owned For
Owner Type
Purchase Details
Closed on
Oct 28, 2003
Sold by
Roebuck Mildred G
Bought by
Criollo Jose
Current Estimated Value
Home Financials for this Owner
Home Financials are based on the most recent Mortgage that was taken out on this home.
Original Mortgage
$257,400
Interest Rate
9%
Mortgage Type
Adjustable Rate Mortgage/ARM
Create a Home Valuation Report for This Property
The Home Valuation Report is an in-depth analysis detailing your home's value as well as a comparison with similar homes in the area
Home Values in the Area
Average Home Value in this Area
Purchase History
| Date | Buyer | Sale Price | Title Company |
|---|---|---|---|
| Criollo Jose | $286,000 | The Judicial Title Insurance |
Source: Public Records
Mortgage History
| Date | Status | Borrower | Loan Amount |
|---|---|---|---|
| Previous Owner | Criollo Jose | $257,400 |
Source: Public Records
Tax History
| Year | Tax Paid | Tax Assessment Tax Assessment Total Assessment is a certain percentage of the fair market value that is determined by local assessors to be the total taxable value of land and additions on the property. | Land | Improvement |
|---|---|---|---|---|
| 2024 | $15,947 | $549,200 | $113,900 | $435,300 |
| 2023 | $14,375 | $512,900 | $113,900 | $399,000 |
| 2022 | $13,137 | $439,600 | $113,900 | $325,700 |
| 2021 | $10,844 | $374,100 | $113,900 | $260,200 |
| 2020 | $12,406 | $355,200 | $113,900 | $241,300 |
| 2019 | $12,101 | $342,500 | $113,900 | $228,600 |
| 2018 | $11,885 | $332,700 | $113,900 | $218,800 |
| 2017 | $1,768 | $332,700 | $113,900 | $218,800 |
| 2016 | $117,353 | $326,200 | $113,900 | $212,300 |
| 2015 | $17,889 | $25,380 | $7,200 | $18,180 |
| 2014 | $17,889 | $25,380 | $7,200 | $18,180 |
| 2013 | $17,889 | $25,380 | $7,200 | $18,180 |
Source: Public Records
Map
Nearby Homes
- 88 Broadway Unit PH1
- 135 Main St Unit 203
- 0 van Wyck St Unit KEY834077
- 135 N Highland Ave
- 143 N Highland Ave
- 16 Maple Place
- 35 Havell St
- 30 Hunter St
- 12 Broad Ave
- 1 Edward St
- 131 Spring St
- 58 State St
- 25 William St
- 38 Terrace Ave
- 139 Spring St
- 36 Watson Ave
- 1 Noel Dr
- 132 Croton Ave
- 59 Watson Ave
- 15 Prospect Ave
Your Personal Tour Guide
Ask me questions while you tour the home.