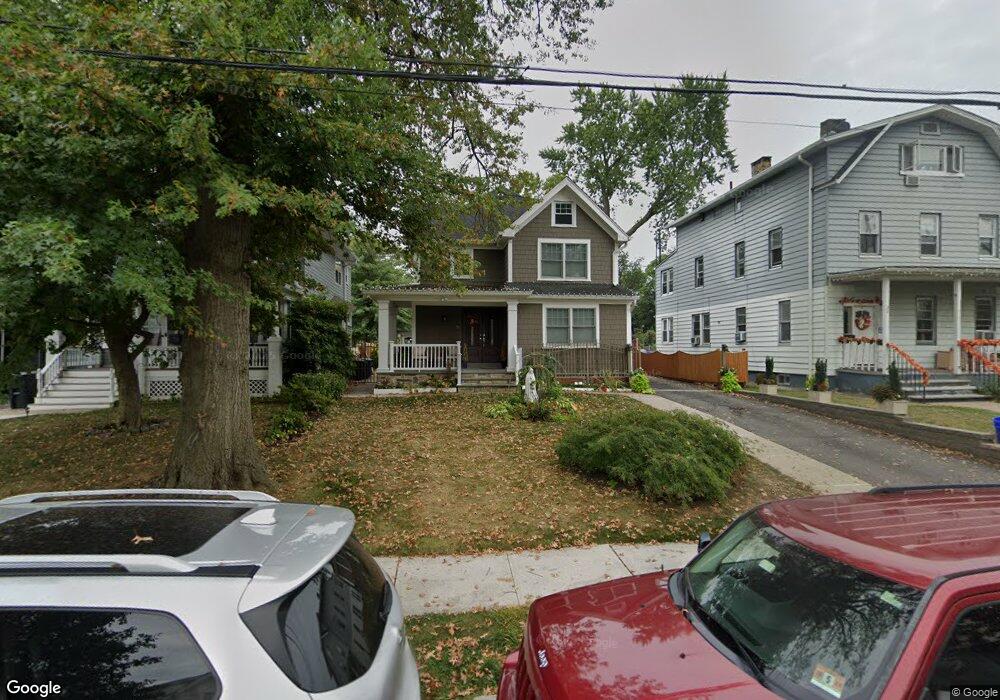
18 New St Bloomfield, NJ 07003
Estimated Value: $782,000 - $895,000
Studio
--
Bath
3,549
Sq Ft
$241/Sq Ft
Est. Value
About This Home
This home is located at 18 New St, Bloomfield, NJ 07003 and is currently estimated at $855,608, approximately $241 per square foot. 18 New St is a home located in Essex County with nearby schools including Franklin School, Bloomfield Middle School, and Bloomfield High School.
Ownership History
Date
Name
Owned For
Owner Type
Purchase Details
Closed on
Oct 11, 2005
Sold by
Swan David
Bought by
Galarza Luis
Current Estimated Value
Home Financials for this Owner
Home Financials are based on the most recent Mortgage that was taken out on this home.
Original Mortgage
$303,920
Outstanding Balance
$163,594
Interest Rate
5.85%
Mortgage Type
New Conventional
Estimated Equity
$692,014
Purchase Details
Closed on
Oct 23, 2002
Sold by
Papaiaani Anthony
Bought by
Swan David
Home Financials for this Owner
Home Financials are based on the most recent Mortgage that was taken out on this home.
Original Mortgage
$237,510
Interest Rate
6.07%
Mortgage Type
FHA
Create a Home Valuation Report for This Property
The Home Valuation Report is an in-depth analysis detailing your home's value as well as a comparison with similar homes in the area
Home Values in the Area
Average Home Value in this Area
Purchase History
We collect this data history from publicly available records. To have your information removed, we recommend requesting removal directly through your county’s website.
| Date | Buyer | Sale Price | Title Company |
|---|---|---|---|
| Galarza Luis | $379,900 | -- | |
| Swan David | $260,000 | -- |
Source: Public Records
Mortgage History
We collect this data history from publicly available records. To have your information removed, we recommend requesting removal directly through your county’s website.
| Date | Status | Borrower | Loan Amount |
|---|---|---|---|
| Open | Galarza Luis | $303,920 | |
| Previous Owner | Swan David | $237,510 |
Source: Public Records
Tax History
| Year | Tax Paid | Tax Assessment Tax Assessment Total Assessment is a certain percentage of the fair market value that is determined by local assessors to be the total taxable value of land and additions on the property. | Land | Improvement |
|---|---|---|---|---|
| 2025 | $18,578 | $547,700 | $142,900 | $404,800 |
| 2024 | $17,899 | $547,700 | $142,900 | $404,800 |
| 2022 | $16,737 | $522,700 | $0 | $0 |
| 2021 | $16,428 | $522,700 | $0 | $0 |
| 2020 | $16,178 | $522,700 | $0 | $0 |
| 2019 | $19,204 | $507,400 | $148,500 | $358,900 |
| 2018 | $19,122 | $507,400 | $148,500 | $358,900 |
| 2017 | $11,868 | $304,000 | $148,500 | $155,500 |
| 2016 | $11,734 | $304,000 | $148,500 | $155,500 |
| 2015 | $11,628 | $304,000 | $148,500 | $155,500 |
| 2014 | $11,415 | $304,000 | $148,500 | $155,500 |
Source: Public Records
Map
Nearby Homes
- 279 Belleville Ave
- 46 Maple St
- 7 Maple St
- 31 Division St
- 124-126 Spruce St
- 124 Spruce St Unit 126
- 65 E Almira St
- 102 State St
- 55 Park Ave
- 55 Park Ave Unit 26
- 169 Walnut St
- 49 Park Ave Unit 5
- 89 Division St
- 29 Edgewood Rd
- 162 Belleville Ave Unit 1A
- 39 Forest Dr
- 20 Edgewood Rd
- 193 Hillside Ave
- 10 E Passaic Ave
- 194 Hillside Ave
Your Personal Tour Guide
Ask me questions while you tour the home.