18 Ostend St Johnston, RI 02919
Hartford Avenue NeighborhoodEstimated Value: $494,000 - $618,000
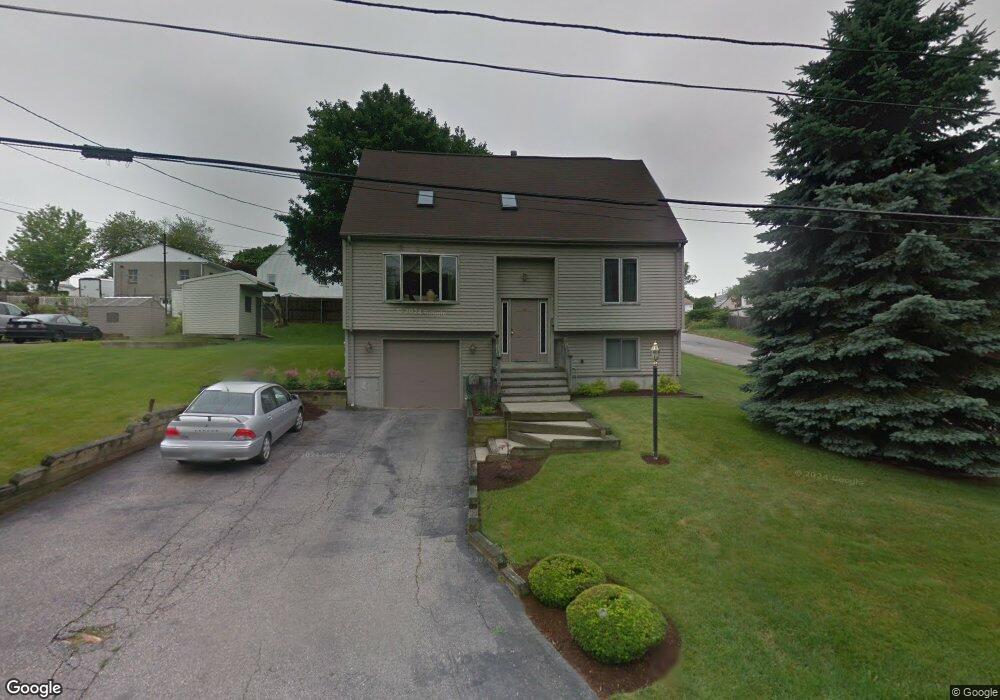
About This Home
This home is located at 18 Ostend St, Johnston, RI 02919 and is currently estimated at $529,609, approximately $372 per square foot. 18 Ostend St is a home located in Providence County with nearby schools including Johnston Senior High School, Achievement First Providence Mayoral Academy Elementary, and Achievement First Providence Mayoral Academy Elementary School.
Ownership History
We collect this data history from publicly available records. To have your information removed, we recommend requesting removal directly through your county’s website.
Purchase Details
Purchase Details
Home Values in the Area
Average Home Value in this Area
Purchase History
We collect this data history from publicly available records. To have your information removed, we recommend requesting removal directly through your county’s website.
| Date | Buyer | Sale Price | Title Company |
|---|---|---|---|
| -- | -- | ||
| $126,500 | -- |
Mortgage History
We collect this data history from publicly available records. To have your information removed, we recommend requesting removal directly through your county’s website.
| Date | Status | Borrower | Loan Amount |
|---|---|---|---|
| Previous Owner | $75,000 | ||
| Previous Owner | $90,000 |
Tax History
We collect this data history from publicly available records. To have your information removed, we recommend requesting removal directly through your county’s website.
| Year | Tax Paid | Tax Assessment Tax Assessment Total Assessment is a certain percentage of the fair market value that is determined by local assessors to be the total taxable value of land and additions on the property. | Land | Improvement |
|---|---|---|---|---|
| 2025 | $6,428 | $411,500 | $91,700 | $319,800 |
| 2024 | $6,296 | $411,500 | $91,700 | $319,800 |
| 2023 | $6,296 | $411,500 | $91,700 | $319,800 |
| 2022 | $5,759 | $247,800 | $70,400 | $177,400 |
| 2021 | $5,759 | $247,800 | $70,400 | $177,400 |
| 2018 | $5,905 | $214,800 | $55,300 | $159,500 |
| 2016 | $7,812 | $214,800 | $55,300 | $159,500 |
| 2015 | $5,720 | $197,300 | $57,800 | $139,500 |
| 2014 | $5,672 | $197,300 | $57,800 | $139,500 |
| 2013 | $5,672 | $197,300 | $57,800 | $139,500 |
Map
- 8 Flanders St
- 6 Flanders St
- 28 City View Pkwy
- 105 Borden Ave
- 97 Victor Ave
- 0 Woodbine St
- 28 Dante Ave
- 12 Arcadia Ave
- 21 Moreland St
- 29 Calumet Ave
- 45 Burnett St
- 15 Hunter Ave
- 620 Killingly St
- 963 Hartford Ave
- 9 Milburn St
- 95 Waterman Ave
- 1137 Hartford Ave Unit 5B
- 78 Cedar St
- 1143 Hartford Ave Unit 4C
- 37 King St
Ask me questions while you tour the home.