18 Otis St Chicopee, MA 01020
Chicopee Falls NeighborhoodEstimated Value: $347,000 - $437,000
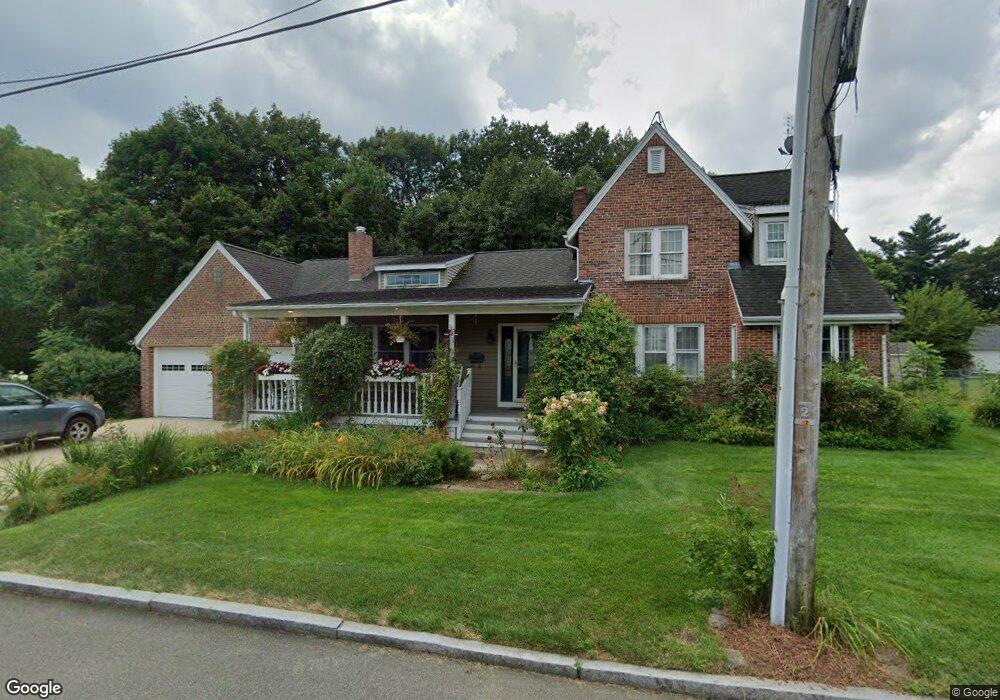
About This Home
This home is located at 18 Otis St, Chicopee, MA 01020 and is currently estimated at $389,594, approximately $177 per square foot. 18 Otis St is a home located in Hampden County with nearby schools including Belcher Elementary School, Bellamy Middle School, and Chicopee High School.
Ownership History
We collect this data history from publicly available records. To have your information removed, we recommend requesting removal directly through your county’s website.
Purchase Details
Home Financials for this Owner
Home Financials are based on the most recent Mortgage that was taken out on this home.Home Values in the Area
Average Home Value in this Area
Purchase History
We collect this data history from publicly available records. To have your information removed, we recommend requesting removal directly through your county’s website.
| Date | Buyer | Sale Price | Title Company |
|---|---|---|---|
| $80,000 | -- |
Mortgage History
We collect this data history from publicly available records. To have your information removed, we recommend requesting removal directly through your county’s website.
| Date | Status | Borrower | Loan Amount |
|---|---|---|---|
| Open | $177,500 | ||
| Closed | $160,000 | ||
| Closed | $64,000 |
Tax History
We collect this data history from publicly available records. To have your information removed, we recommend requesting removal directly through your county’s website.
| Year | Tax Paid | Tax Assessment Tax Assessment Total Assessment is a certain percentage of the fair market value that is determined by local assessors to be the total taxable value of land and additions on the property. | Land | Improvement |
|---|---|---|---|---|
| 2025 | $5,209 | $343,600 | $96,200 | $247,400 |
| 2024 | $4,937 | $334,500 | $94,400 | $240,100 |
| 2023 | $4,634 | $305,900 | $85,800 | $220,100 |
| 2022 | $4,419 | $260,100 | $74,600 | $185,500 |
| 2021 | $4,107 | $233,200 | $64,100 | $169,100 |
| 2020 | $3,902 | $223,500 | $64,100 | $159,400 |
| 2019 | $3,817 | $212,500 | $64,100 | $148,400 |
| 2018 | $3,832 | $202,100 | $61,000 | $141,100 |
| 2017 | $3,832 | $221,400 | $54,300 | $167,100 |
| 2016 | $3,899 | $230,600 | $54,300 | $176,300 |
| 2015 | $3,936 | $224,400 | $54,300 | $170,100 |
| 2014 | $1,968 | $224,400 | $54,300 | $170,100 |
Map
- 75 Wheatland Ave
- 265 Wheatland Ave
- 582 Broadway St
- 221 East St
- 132 Ondrick Dr
- 115 Bonneville Ave
- 264 E Main St
- 101 Frontenac St
- 44 White St
- 17 Hearthstone Terrace
- 154 Russell St
- 51 E Canton Cir
- 22 Felicia St
- 271 Wildermere St
- 78 Glendale St
- 23 Wildermere St
- 156 Grattan St
- 151 Edgewood Ave
- 74 Rochester St
- 118 Edgewood Ave
Ask me questions while you tour the home.