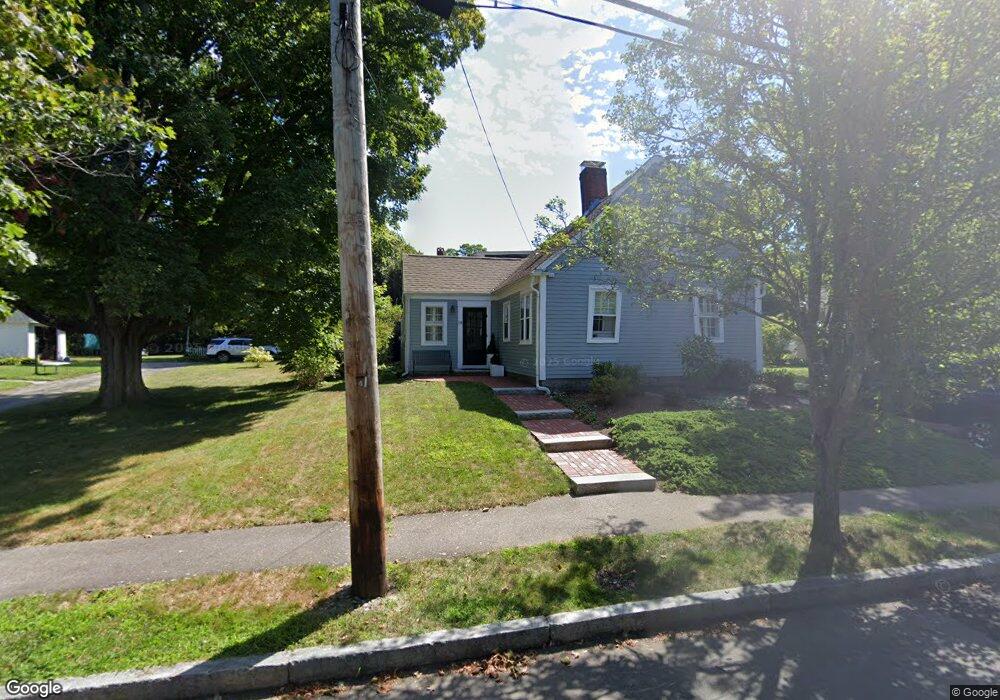
18 Pond St Hingham, MA 02043
Estimated Value: $924,000 - $1,262,000
2
Beds
2
Baths
1,527
Sq Ft
$688/Sq Ft
Est. Value
About This Home
This home is located at 18 Pond St, Hingham, MA 02043 and is currently estimated at $1,050,712, approximately $688 per square foot. 18 Pond St is a home located in Plymouth County with nearby schools including East Elementary School, Hingham Middle School, and Hingham High School.
Ownership History
Date
Name
Owned For
Owner Type
Purchase Details
Closed on
Jan 25, 2002
Sold by
Bilodeau Thomas H and Bilodeau Kelly
Bought by
Rohleder Lori M and Rohleder Richard D
Current Estimated Value
Purchase Details
Closed on
Aug 13, 1998
Sold by
Lynne P Doran Ft and Bucklen Lynne P
Bought by
Bilodeau Thomas H and Bilodeau Kelly M
Purchase Details
Closed on
Sep 7, 1988
Sold by
Winokur Gerald N
Bought by
Magner Paul
Create a Home Valuation Report for This Property
The Home Valuation Report is an in-depth analysis detailing your home's value as well as a comparison with similar homes in the area
Purchase History
| Date | Buyer | Sale Price | Title Company |
|---|---|---|---|
| Rohleder Lori M | $424,250 | -- | |
| Bilodeau Thomas H | $254,000 | -- | |
| Magner Paul | $173,000 | -- |
Source: Public Records
Mortgage History
| Date | Status | Borrower | Loan Amount |
|---|---|---|---|
| Open | Magner Paul | $292,000 | |
| Closed | Magner Paul | $60,000 |
Source: Public Records
Tax History
| Year | Tax Paid | Tax Assessment Tax Assessment Total Assessment is a certain percentage of the fair market value that is determined by local assessors to be the total taxable value of land and additions on the property. | Land | Improvement |
|---|---|---|---|---|
| 2025 | $8,610 | $805,400 | $460,300 | $345,100 |
| 2024 | $8,655 | $797,700 | $460,300 | $337,400 |
| 2023 | $7,869 | $786,900 | $460,300 | $326,600 |
| 2022 | $7,902 | $683,600 | $415,600 | $268,000 |
| 2021 | $7,750 | $656,800 | $399,600 | $257,200 |
| 2020 | $7,573 | $656,800 | $399,600 | $257,200 |
| 2019 | $6,612 | $559,900 | $399,600 | $160,300 |
| 2018 | $6,554 | $556,800 | $399,600 | $157,200 |
| 2017 | $6,472 | $528,300 | $379,300 | $149,000 |
| 2016 | $6,374 | $510,300 | $361,300 | $149,000 |
| 2015 | $6,176 | $492,900 | $344,100 | $148,800 |
Source: Public Records
Map
Nearby Homes
Your Personal Tour Guide
Ask me questions while you tour the home.