18 Regency Dr Bourne, MA 2532
Estimated Value: $419,000 - $513,000
About This Home
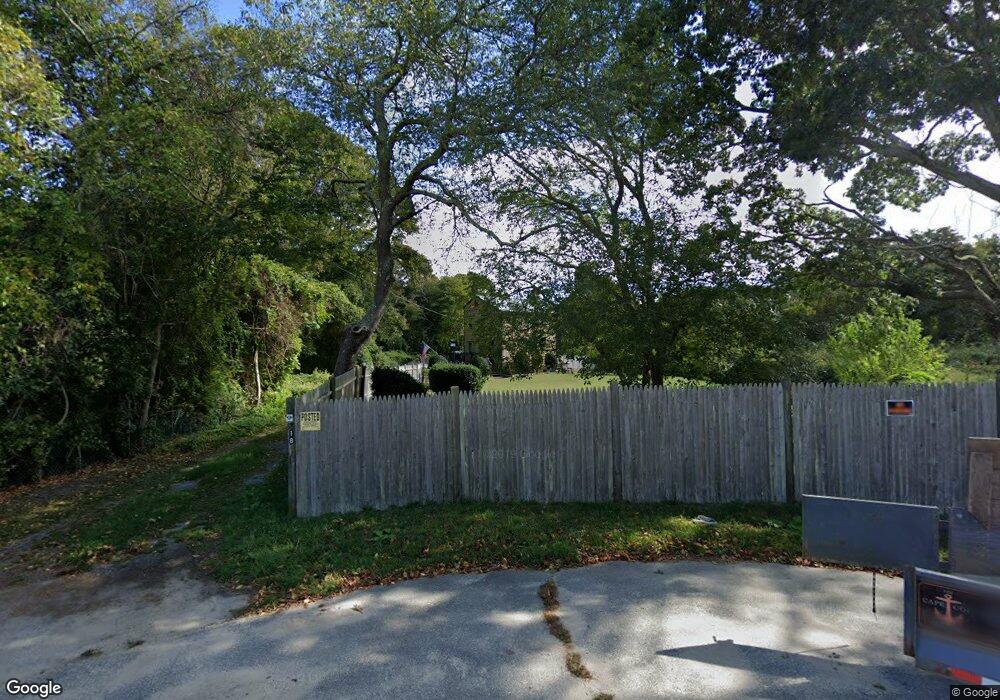
This home is located at 18 Regency Dr, Bourne, MA 2532 and is currently estimated at $462,710, approximately $525 per square foot. 18 Regency Dr is a home located in Barnstable County with nearby schools including Bourne High School, Bridgeview Montessori School, and Waldorf School of Cape Cod.
Ownership History
We collect this data history from publicly available records. To have your information removed, we recommend requesting removal directly through your county’s website.
Purchase Details
Home Financials for this Owner
Home Financials are based on the most recent Mortgage that was taken out on this home.Home Values in the Area
Average Home Value in this Area
Purchase History
We collect this data history from publicly available records. To have your information removed, we recommend requesting removal directly through your county’s website.
| Date | Buyer | Sale Price | Title Company |
|---|---|---|---|
| $75,000 | -- | ||
| $75,000 | -- |
Mortgage History
We collect this data history from publicly available records. To have your information removed, we recommend requesting removal directly through your county’s website.
| Date | Status | Borrower | Loan Amount |
|---|---|---|---|
| Open | $65,000 | ||
| Closed | $65,000 | ||
| Closed | $67,500 |
Tax History
We collect this data history from publicly available records. To have your information removed, we recommend requesting removal directly through your county’s website.
| Year | Tax Paid | Tax Assessment Tax Assessment Total Assessment is a certain percentage of the fair market value that is determined by local assessors to be the total taxable value of land and additions on the property. | Land | Improvement |
|---|---|---|---|---|
| 2025 | $2,620 | $335,500 | $175,400 | $160,100 |
| 2024 | $2,562 | $319,500 | $167,000 | $152,500 |
| 2023 | $2,491 | $282,700 | $147,800 | $134,900 |
| 2022 | $2,400 | $237,900 | $130,800 | $107,100 |
| 2021 | $663 | $216,600 | $119,100 | $97,500 |
| 2020 | $2,164 | $211,100 | $117,900 | $93,200 |
| 2019 | $2,163 | $205,800 | $117,900 | $87,900 |
| 2018 | $638 | $196,000 | $112,300 | $83,700 |
| 2017 | $649 | $187,600 | $111,300 | $76,300 |
| 2016 | $1,765 | $173,700 | $98,900 | $74,800 |
| 2015 | $1,749 | $173,700 | $98,900 | $74,800 |
Map
- 6 Luigi Ave
- 18 Gibbs Rd
- 51 Commonwealth Ave
- 896 Sandwich Rd
- 4 Andrew Rd
- 48 Tyler Dr
- 22 Windswept Dr
- 21 Seneca Ln
- 1 Homestead Rd
- 71 Tupper Rd
- 566 Massachusetts 6a
- 11 Tower Hill Dr
- 16 Ocean Pines Dr Unit A
- 15 Clark Rd
- 14 Sir Lancelot Dr
- 5 Dale Terrace Extension
- 115 Phillips Rd
- 2-A Bodfish Ave
- 1 Moody Dr
- E 2 Beach Plum Ln Unit E
Ask me questions while you tour the home.