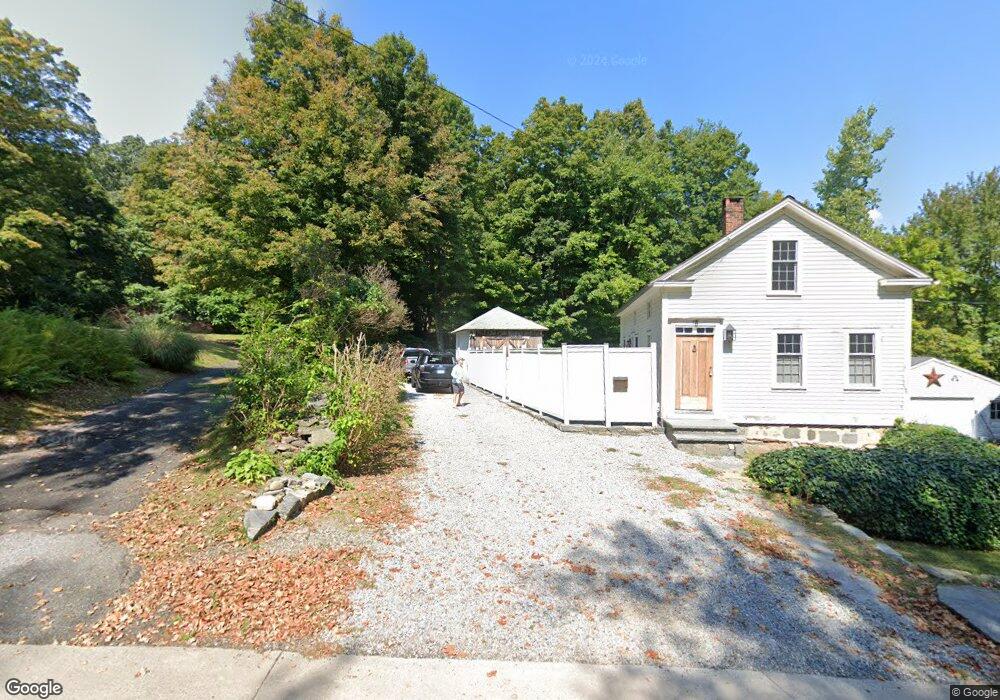
18 Spring St Deep River, CT 06417
Estimated Value: $343,482 - $365,000
2
Beds
2
Baths
1,131
Sq Ft
$312/Sq Ft
Est. Value
About This Home
This home is located at 18 Spring St, Deep River, CT 06417 and is currently estimated at $353,121, approximately $312 per square foot. 18 Spring St is a home located in Middlesex County with nearby schools including Valley Regional High School.
Ownership History
Date
Name
Owned For
Owner Type
Purchase Details
Closed on
Sep 29, 1997
Sold by
Rocco Gail E
Bought by
Smith Stephen T and Parker Tracy L
Current Estimated Value
Home Financials for this Owner
Home Financials are based on the most recent Mortgage that was taken out on this home.
Original Mortgage
$113,400
Interest Rate
7.88%
Mortgage Type
Unknown
Purchase Details
Closed on
May 30, 1991
Sold by
Maffei Joseph Est
Bought by
Rocco Gaile
Create a Home Valuation Report for This Property
The Home Valuation Report is an in-depth analysis detailing your home's value as well as a comparison with similar homes in the area
Home Values in the Area
Average Home Value in this Area
Purchase History
| Date | Buyer | Sale Price | Title Company |
|---|---|---|---|
| Smith Stephen T | $117,000 | -- | |
| Rocco Gaile | $90,000 | -- |
Source: Public Records
Mortgage History
| Date | Status | Borrower | Loan Amount |
|---|---|---|---|
| Open | Rocco Gaile | $206,000 | |
| Closed | Rocco Gaile | $92,300 | |
| Closed | Rocco Gaile | $39,000 | |
| Closed | Rocco Gaile | $113,400 |
Source: Public Records
Tax History
| Year | Tax Paid | Tax Assessment Tax Assessment Total Assessment is a certain percentage of the fair market value that is determined by local assessors to be the total taxable value of land and additions on the property. | Land | Improvement |
|---|---|---|---|---|
| 2025 | $4,385 | $137,130 | $42,840 | $94,290 |
| 2024 | $4,303 | $137,130 | $42,840 | $94,290 |
| 2023 | $4,097 | $137,130 | $42,840 | $94,290 |
| 2022 | $3,974 | $137,130 | $42,840 | $94,290 |
| 2021 | $4,056 | $137,130 | $42,840 | $94,290 |
| 2020 | $4,228 | $140,980 | $43,540 | $97,440 |
| 2019 | $5,077 | $140,980 | $43,540 | $97,440 |
| 2018 | $5,077 | $140,980 | $43,540 | $97,440 |
| 2017 | $4,952 | $140,980 | $43,540 | $97,440 |
| 2016 | $3,881 | $140,980 | $43,540 | $97,440 |
| 2015 | $3,458 | $131,600 | $48,370 | $83,230 |
| 2014 | $3,406 | $131,600 | $48,370 | $83,230 |
Source: Public Records
Map
Nearby Homes
- 92 Main St Unit 202
- 92 Main St Unit 206
- 92 Main St Unit 101
- 87 Main St
- 11 Winter Ave
- 8 Prospect Hill
- 33 Castle Heights
- 62 River St
- 170 Main St
- 113 Union St Unit Z
- 209 Main St
- 25 Union St
- 43 Bokum Rd
- 79 Middlesex Ave
- 6 Pelton Hill Rd
- 1 Ferry Rd
- 11 Kings Hwy
- 26 Ferry Rd
- 134 Meadow Woods Rd
- 120 Warsaw St
Your Personal Tour Guide
Ask me questions while you tour the home.