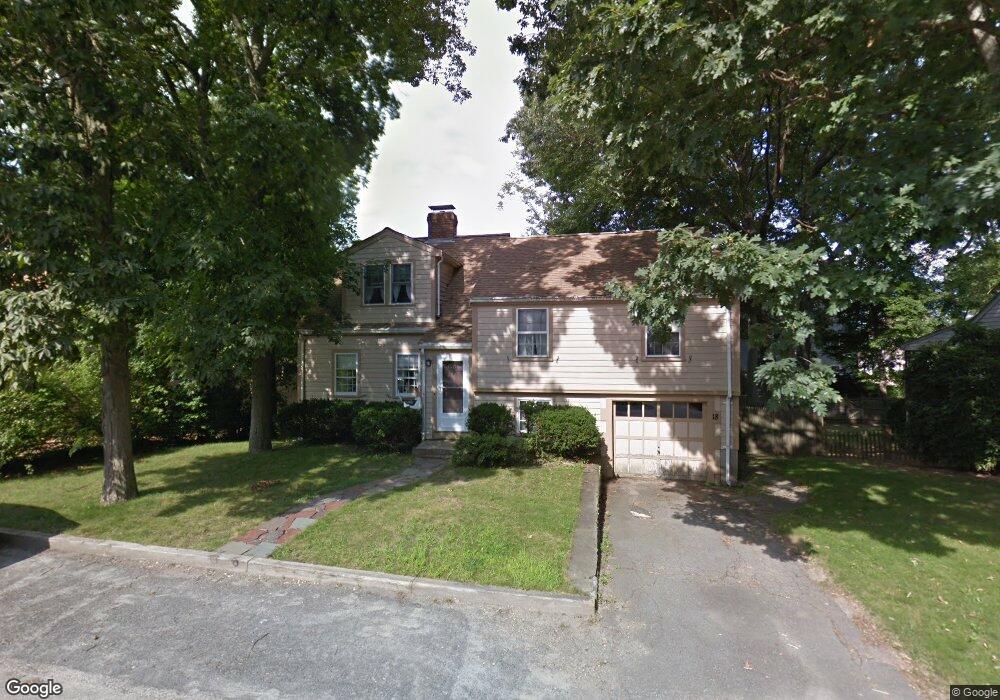
18 Sutton St Weymouth, MA 02188
East Weymouth NeighborhoodEstimated Value: $711,149 - $795,000
3
Beds
1
Bath
1,732
Sq Ft
$433/Sq Ft
Est. Value
About This Home
This home is located at 18 Sutton St, Weymouth, MA 02188 and is currently estimated at $749,537, approximately $432 per square foot. 18 Sutton St is a home located in Norfolk County with nearby schools including Academy Avenue Elementary School, Abigail Adams Middle School, and Weymouth Middle School Chapman.
Ownership History
Date
Name
Owned For
Owner Type
Purchase Details
Closed on
Oct 29, 1992
Sold by
Gaudreau Russell A and Gaudreau Jean E
Bought by
Wight William D and Wight Debra M
Current Estimated Value
Home Financials for this Owner
Home Financials are based on the most recent Mortgage that was taken out on this home.
Original Mortgage
$100,000
Interest Rate
7.85%
Mortgage Type
Purchase Money Mortgage
Create a Home Valuation Report for This Property
The Home Valuation Report is an in-depth analysis detailing your home's value as well as a comparison with similar homes in the area
Home Values in the Area
Average Home Value in this Area
Purchase History
| Date | Buyer | Sale Price | Title Company |
|---|---|---|---|
| Wight William D | $136,000 | -- |
Source: Public Records
Mortgage History
| Date | Status | Borrower | Loan Amount |
|---|---|---|---|
| Open | Wight William D | $88,100 | |
| Closed | Wight William D | $100,000 |
Source: Public Records
Tax History
| Year | Tax Paid | Tax Assessment Tax Assessment Total Assessment is a certain percentage of the fair market value that is determined by local assessors to be the total taxable value of land and additions on the property. | Land | Improvement |
|---|---|---|---|---|
| 2025 | $7,347 | $727,400 | $238,900 | $488,500 |
| 2024 | $7,183 | $699,400 | $227,600 | $471,800 |
| 2023 | $6,830 | $653,600 | $210,700 | $442,900 |
| 2022 | $6,673 | $582,300 | $195,100 | $387,200 |
| 2021 | $6,004 | $511,400 | $195,100 | $316,300 |
| 2020 | $5,731 | $480,800 | $195,100 | $285,700 |
| 2019 | $5,631 | $464,600 | $187,600 | $277,000 |
| 2018 | $5,575 | $446,000 | $186,100 | $259,900 |
| 2017 | $5,215 | $407,100 | $177,300 | $229,800 |
| 2016 | $5,051 | $394,600 | $170,500 | $224,100 |
| 2015 | $4,828 | $374,300 | $170,500 | $203,800 |
| 2014 | $4,622 | $347,500 | $158,600 | $188,900 |
Source: Public Records
Map
Nearby Homes
- 211 Roosevelt Rd
- 148 Chard St
- 29 Church St Unit 22
- 951 Commercial St
- 80 Manzanetta Ave
- 270 Middle St
- 70 Biscayne Ave
- 5 Endicott St
- 70 Colonial Rd
- 575 Broad St Unit 315
- 575 Broad St Unit 306
- 575 Broad St Unit 215
- 26 Wingate Rd
- 67 Charles St
- 30 Puritan Rd
- 71 Charles St
- 201 Lake St Unit 30
- 425 East St
- 29 Arnold Rd
- 25 Richmond St
Your Personal Tour Guide
Ask me questions while you tour the home.