18 Sutton St Weymouth, MA 02188
East Weymouth NeighborhoodEstimated Value: $754,287 - $820,000
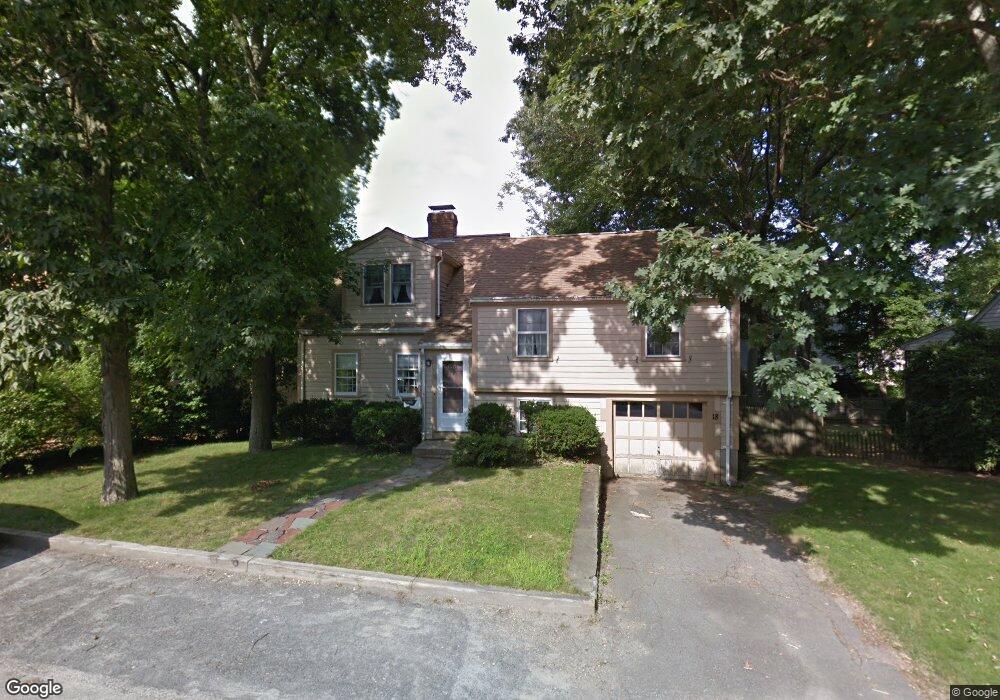
About This Home
This home is located at 18 Sutton St, Weymouth, MA 02188 and is currently estimated at $774,822, approximately $447 per square foot. 18 Sutton St is a home located in Norfolk County with nearby schools including Academy Avenue Elementary School, Abigail Adams Middle School, and Weymouth Middle School Chapman.
Ownership History
We collect this data history from publicly available records. To have your information removed, we recommend requesting removal directly through your county’s website.
Purchase Details
Home Values in the Area
Average Home Value in this Area
Purchase History
We collect this data history from publicly available records. To have your information removed, we recommend requesting removal directly through your county’s website.
| Date | Buyer | Sale Price | Title Company |
|---|---|---|---|
| $136,000 | -- |
Mortgage History
We collect this data history from publicly available records. To have your information removed, we recommend requesting removal directly through your county’s website.
| Date | Status | Borrower | Loan Amount |
|---|---|---|---|
| Open | $150,000 | ||
| Closed | $88,100 |
Tax History
We collect this data history from publicly available records. To have your information removed, we recommend requesting removal directly through your county’s website.
| Year | Tax Paid | Tax Assessment Tax Assessment Total Assessment is a certain percentage of the fair market value that is determined by local assessors to be the total taxable value of land and additions on the property. | Land | Improvement |
|---|---|---|---|---|
| 2025 | $7,347 | $727,400 | $238,900 | $488,500 |
| 2024 | $7,183 | $699,400 | $227,600 | $471,800 |
| 2023 | $6,830 | $653,600 | $210,700 | $442,900 |
| 2022 | $6,673 | $582,300 | $195,100 | $387,200 |
| 2021 | $6,004 | $511,400 | $195,100 | $316,300 |
| 2020 | $5,731 | $480,800 | $195,100 | $285,700 |
| 2019 | $5,631 | $464,600 | $187,600 | $277,000 |
| 2018 | $5,575 | $446,000 | $186,100 | $259,900 |
| 2017 | $5,215 | $407,100 | $177,300 | $229,800 |
| 2016 | $5,051 | $394,600 | $170,500 | $224,100 |
| 2015 | $4,828 | $374,300 | $170,500 | $203,800 |
| 2014 | $4,622 | $347,500 | $158,600 | $188,900 |
Map
- 125 Jaffrey St
- 484 Essex St
- 164 Candia St
- 22 Priscilla Cir
- 696 Commercial St
- 10 Richards Rd
- 630 North St
- 612 North St
- 45 Presidents Rd
- 493 Broad St
- 43 Harding Ave
- 27 Church St Unit 11
- 6 Bell Rd
- 140 Middle St
- 89 Trefton Ave
- 86 Abigail Adams Cir
- 102 Manzanetta Ave
- 81 Meredith Way
- 31 Charles St
- 575 Broad St Unit 312
Ask me questions while you tour the home.