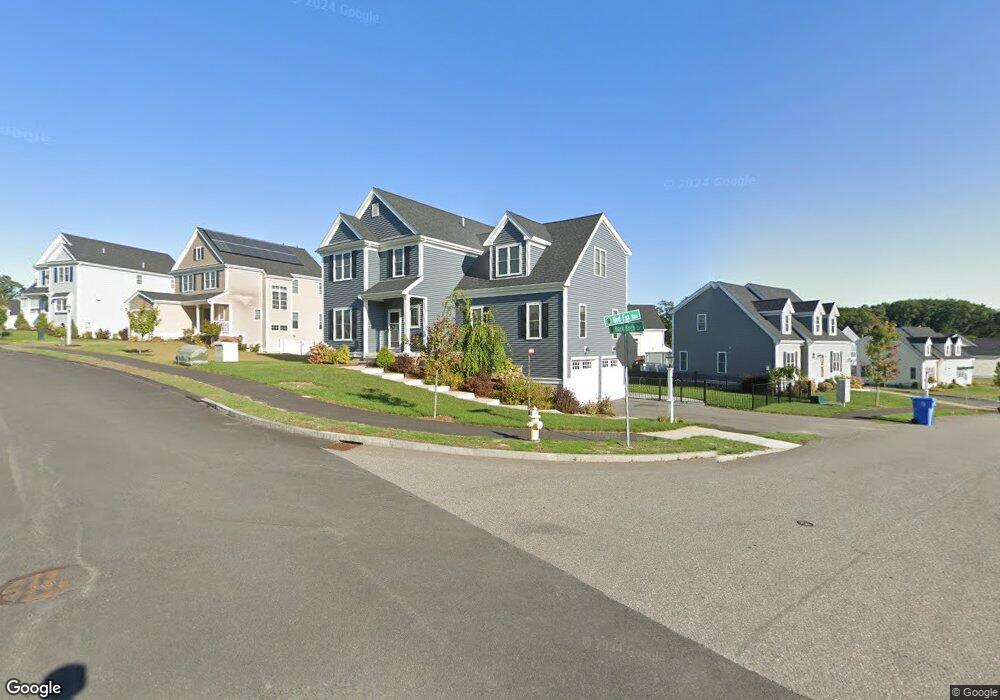
180 Red Fox Run Wrentham, MA 02093
Estimated Value: $870,439 - $1,112,000
About This Home
This home is located at 180 Red Fox Run, Wrentham, MA 02093 and is currently estimated at $951,360, approximately $356 per square foot. 180 Red Fox Run is a home with nearby schools including Delaney Elementary School and Charles E Roderick.
Ownership History
We collect this data history from publicly available records. To have your information removed, we recommend requesting removal directly through your county’s website.
Purchase Details
Purchase Details
Home Financials for this Owner
Home Financials are based on the most recent Mortgage that was taken out on this home.Purchase History
We collect this data history from publicly available records. To have your information removed, we recommend requesting removal directly through your county’s website.
| Date | Buyer | Sale Price | Title Company |
|---|---|---|---|
| -- | None Available | ||
| $457,900 | -- |
Mortgage History
We collect this data history from publicly available records. To have your information removed, we recommend requesting removal directly through your county’s website.
| Date | Status | Borrower | Loan Amount |
|---|---|---|---|
| Previous Owner | $410,000 |
Tax History
We collect this data history from publicly available records. To have your information removed, we recommend requesting removal directly through your county’s website.
| Year | Tax Paid | Tax Assessment Tax Assessment Total Assessment is a certain percentage of the fair market value that is determined by local assessors to be the total taxable value of land and additions on the property. | Land | Improvement |
|---|---|---|---|---|
| 2025 | $9,302 | $802,600 | $221,400 | $581,200 |
| 2024 | $8,764 | $730,300 | $221,400 | $508,900 |
| 2023 | $8,642 | $684,800 | $201,300 | $483,500 |
| 2022 | $8,350 | $610,800 | $195,800 | $415,000 |
| 2021 | $7,938 | $564,200 | $183,000 | $381,200 |
| 2020 | $7,833 | $549,700 | $139,700 | $410,000 |
| 2019 | $7,364 | $521,500 | $139,700 | $381,800 |
| 2018 | $6,839 | $480,300 | $140,200 | $340,100 |
| 2017 | $6,495 | $455,800 | $123,700 | $332,100 |
| 2016 | $428 | $30,000 | $30,000 | $0 |
| 2015 | $481 | $32,100 | $32,100 | $0 |
| 2014 | $473 | $30,900 | $30,900 | $0 |
Map
- 14 Parkview Rd Unit 14
- 300 Lafayette Ave
- 315 Park St
- 165 Harvard Ln
- 28 Park St
- 8 Aspen Way
- 107 Mill St
- 118 Woolford Rd
- 371 & 377 Franklin St
- 9 Elliot Mills Unit 5
- 8 Elliot Mills Unit 30
- 5 Elliot Mills Unit 3
- 7 Elliot Mills Unit 4
- 10 Elliot Mills Unit 29
- 23 Juniper Rd
- 41 Jordan Rd
- 18 A St
- 5 Magnolia Dr Unit 5
- 730 Eastside Rd
- 28 Waites Crossing
- 150 Black Birch Dr
- 174 Red Fox Run
- 165 Red Fox Run
- 15 Pheasant Run Ct Unit 53
- 155 Black Birch Dr
- 160 Black Birch Dr
- 155 Red Fox Run
- 135 Black Birch Dr
- 145 Black Birch Dr
- 25 Pheasant Run Ct
- 165 Black Birch Dr
- 130 Black Birch Dr
- 145 Red Fox Run
- 175 Black Birch Dr
- 172 Red Fox Run
- 170 Black Birch Dr
- 35 Pheasant Run Ct
- 0 Pheasant Run Ct Unit 64
- 120 Black Birch Dr
- 135 Red Fox Run
Ask me questions while you tour the home.