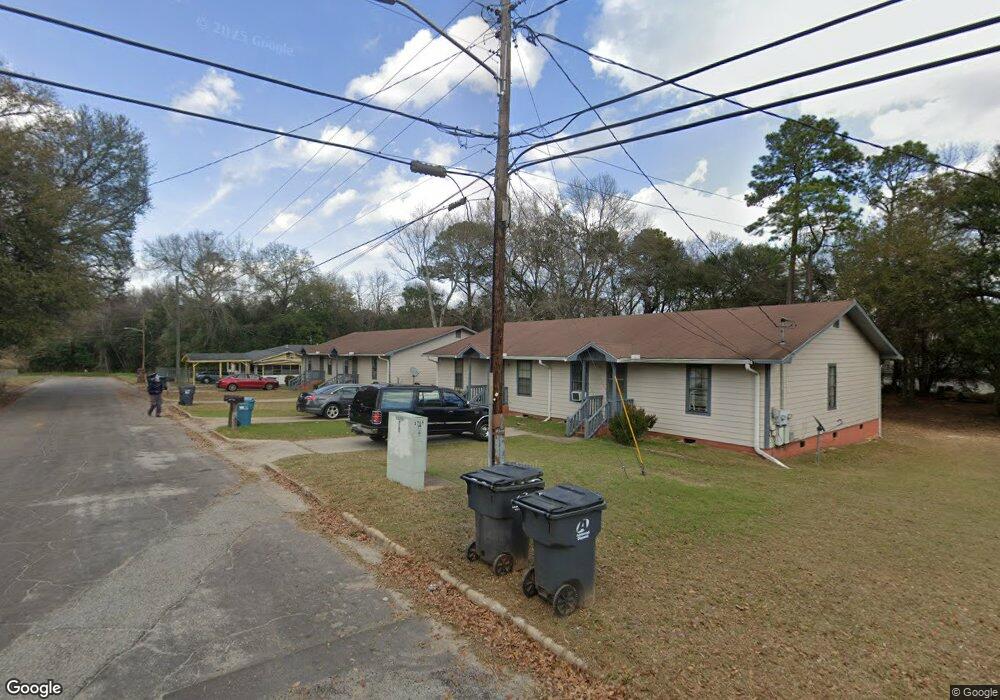
1805 Maxwell St Americus, GA 31719
Estimated Value: $93,000 - $207,000
6
Beds
2
Baths
2,160
Sq Ft
$72/Sq Ft
Est. Value
About This Home
This home is located at 1805 Maxwell St, Americus, GA 31719 and is currently estimated at $156,539, approximately $72 per square foot. 1805 Maxwell St is a home located in Sumter County with nearby schools including Sumter County Primary School, Sumter County Elementary School, and Sumter County Middle School.
Ownership History
Date
Name
Owned For
Owner Type
Purchase Details
Closed on
Feb 16, 2021
Sold by
Cooper Albert
Bought by
Karl Clayton Properties Llc
Current Estimated Value
Purchase Details
Closed on
Dec 30, 2009
Sold by
Sb & T Bank
Bought by
Cooper Albert and Cooper Josephine
Home Financials for this Owner
Home Financials are based on the most recent Mortgage that was taken out on this home.
Original Mortgage
$86,185
Interest Rate
4.68%
Mortgage Type
Future Advance Clause Open End Mortgage
Purchase Details
Closed on
Dec 1, 2009
Sold by
Baker Aaron
Bought by
Sb & T Bank
Home Financials for this Owner
Home Financials are based on the most recent Mortgage that was taken out on this home.
Original Mortgage
$86,185
Interest Rate
4.68%
Mortgage Type
Future Advance Clause Open End Mortgage
Purchase Details
Closed on
Feb 20, 1995
Bought by
Baker Aaron
Purchase Details
Closed on
Oct 29, 1981
Bought by
Bishop Of Diocese
Create a Home Valuation Report for This Property
The Home Valuation Report is an in-depth analysis detailing your home's value as well as a comparison with similar homes in the area
Purchase History
| Date | Buyer | Sale Price | Title Company |
|---|---|---|---|
| Karl Clayton Properties Llc | -- | -- | |
| Cooper Albert | $56,000 | -- | |
| Sb & T Bank | -- | -- | |
| Baker Aaron | $9,000 | -- | |
| Bishop Of Diocese | $5,000 | -- |
Source: Public Records
Mortgage History
| Date | Status | Borrower | Loan Amount |
|---|---|---|---|
| Previous Owner | Cooper Albert | $86,185 |
Source: Public Records
Tax History
| Year | Tax Paid | Tax Assessment Tax Assessment Total Assessment is a certain percentage of the fair market value that is determined by local assessors to be the total taxable value of land and additions on the property. | Land | Improvement |
|---|---|---|---|---|
| 2025 | $2,250 | $49,880 | $5,000 | $44,880 |
| 2024 | $2,250 | $49,880 | $5,000 | $44,880 |
| 2023 | $2,201 | $49,880 | $5,000 | $44,880 |
| 2022 | $1,507 | $49,880 | $5,000 | $44,880 |
| 2021 | $2,204 | $49,880 | $5,000 | $44,880 |
| 2020 | $2,257 | $49,880 | $5,000 | $44,880 |
| 2019 | $2,387 | $49,880 | $5,000 | $44,880 |
| 2018 | $1,569 | $49,880 | $5,000 | $44,880 |
| 2017 | $1,569 | $49,880 | $5,000 | $44,880 |
| 2016 | $2,204 | $49,880 | $5,000 | $44,880 |
| 2015 | $1,726 | $56,360 | $5,000 | $51,360 |
| 2014 | $1,728 | $56,360 | $5,000 | $51,360 |
| 2013 | -- | $56,360 | $5,000 | $51,360 |
Source: Public Records
Map
Nearby Homes
- 310 Tabby Ln
- 414 Patterson St
- 1708 Armory Dr
- 302 Patton Dr
- 207 Eckles Rd
- 732 McGarrah St
- 914 Adderton St
- 428 Rawley Rd
- 420 Rawley Rd
- 434 Rawley Rd
- 402 Rawley Rd
- 333 Academy St
- 166 Lakeshore Dr
- 181 Lakeshore Dr
- 604 A-C Ga Hwy 49s
- 253 Ga Hwy 27e
- 909 Hwy E Ga Hwy 27e
- 466 A-B Hwy 280e
- Lots 5 6 13 14 Hwy 49n
- 116 E Church St
Your Personal Tour Guide
Ask me questions while you tour the home.