181 Main Rd S Hampden, ME 04444
Estimated Value: $274,000 - $304,956
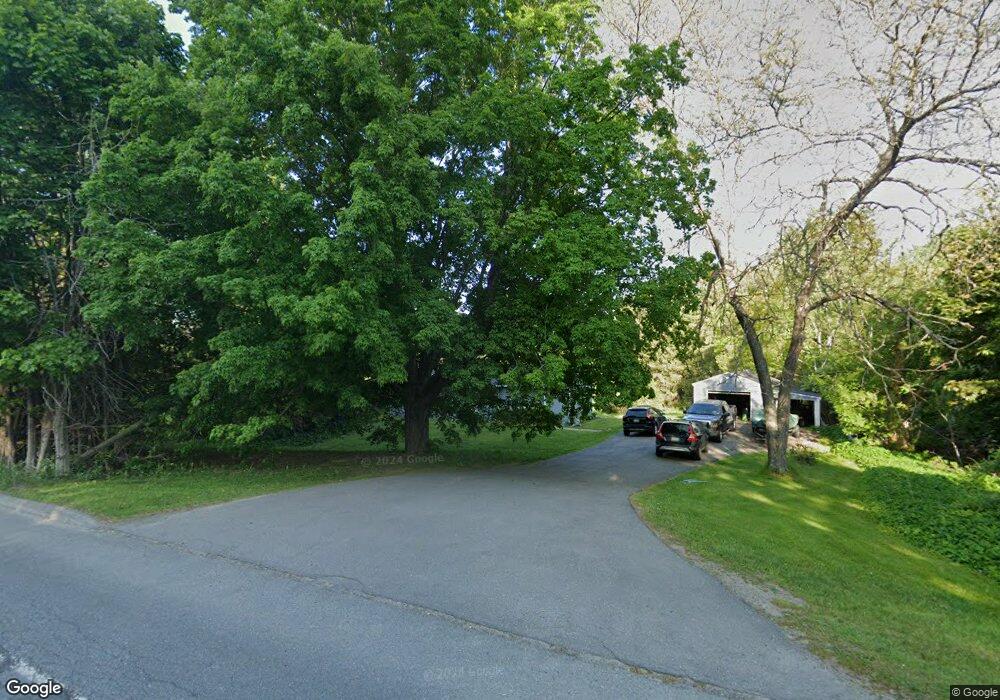
About This Home
This home is located at 181 Main Rd S, Hampden, ME 04444 and is currently estimated at $290,319, approximately $207 per square foot. 181 Main Rd S is a home located in Penobscot County.
Ownership History
We collect this data history from publicly available records. To have your information removed, we recommend requesting removal directly through your county’s website.
Purchase Details
Home Financials for this Owner
Home Financials are based on the most recent Mortgage that was taken out on this home.Purchase Details
Home Financials for this Owner
Home Financials are based on the most recent Mortgage that was taken out on this home.Home Values in the Area
Average Home Value in this Area
Purchase History
We collect this data history from publicly available records. To have your information removed, we recommend requesting removal directly through your county’s website.
| Date | Buyer | Sale Price | Title Company |
|---|---|---|---|
| -- | -- | ||
| -- | -- |
Mortgage History
We collect this data history from publicly available records. To have your information removed, we recommend requesting removal directly through your county’s website.
| Date | Status | Borrower | Loan Amount |
|---|---|---|---|
| Open | $122,462 | ||
| Previous Owner | $136,300 |
Tax History
We collect this data history from publicly available records. To have your information removed, we recommend requesting removal directly through your county’s website.
| Year | Tax Paid | Tax Assessment Tax Assessment Total Assessment is a certain percentage of the fair market value that is determined by local assessors to be the total taxable value of land and additions on the property. | Land | Improvement |
|---|---|---|---|---|
| 2025 | $3,931 | $222,740 | $113,460 | $109,280 |
| 2024 | $3,133 | $200,200 | $102,000 | $98,200 |
| 2023 | $3,163 | $164,300 | $83,700 | $80,600 |
| 2022 | $2,975 | $143,700 | $73,200 | $70,500 |
| 2021 | $2,975 | $143,700 | $73,200 | $70,500 |
| 2020 | $2,931 | $143,700 | $73,200 | $70,500 |
| 2019 | $2,850 | $139,700 | $71,100 | $68,600 |
| 2018 | $2,738 | $139,700 | $71,100 | $68,600 |
| 2017 | $226 | $139,700 | $71,100 | $68,600 |
| 2016 | $2,677 | $140,000 | $71,000 | $69,000 |
| 2015 | $2,363 | $135,000 | $71,000 | $64,000 |
| 2014 | $2,364 | $135,100 | $71,100 | $64,000 |
| 2013 | $2,249 | $135,100 | $71,100 | $64,000 |
Map
- 178 Main Rd S
- 1 Honey Hill Ln
- Lot 7 Honey Hill Estates Ln
- Lot 19 Honey Hill Estates Ln
- Lot 21 Honey Hill Estates
- Lot 10 Honey Hill Estates Ln
- 10 Highland Ridge Dr
- 59 Summer St
- 91 Kennebec Rd
- 99 Kennebec Rd
- 80 Summer St
- 754 River Rd
- M14 L23A Ferry Rd
- M2 L117A River Rd
- 845 River Rd
- 69 Cottage St
- 65 Center Dr
- 418 Main Rd S
- 25 Constitution Ave
- 47 Main Rd N
Ask me questions while you tour the home.