Estimated Value: $123,072 - $194,000
3
Beds
2
Baths
1,120
Sq Ft
$146/Sq Ft
Est. Value
About This Home
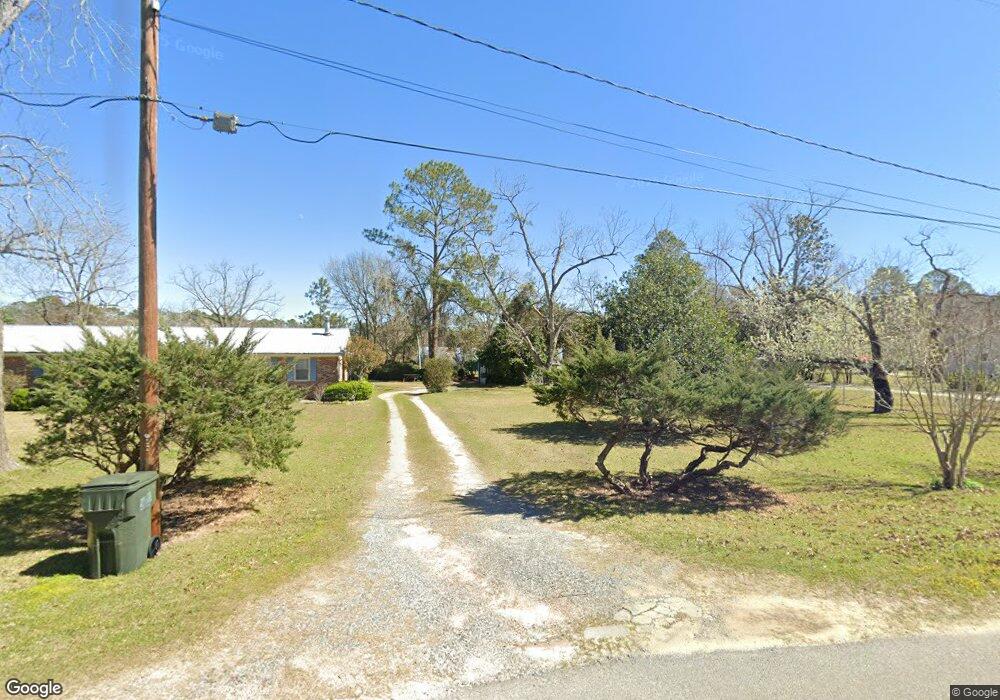
This home is located at 181 Wetherington St, Cecil, GA 31627 and is currently estimated at $163,024, approximately $145 per square foot. 181 Wetherington St is a home located in Cook County with nearby schools including Cook Primary School, Cook Elementary School, and Cook County Middle School.
Ownership History
Date
Name
Owned For
Owner Type
Purchase Details
Closed on
Aug 31, 2022
Sold by
Serenity Jamarea Llc
Bought by
Fogle Mary
Current Estimated Value
Purchase Details
Closed on
Jul 20, 2020
Sold by
Fogle Mary Rose
Bought by
Serenity Jamarea Llc
Purchase Details
Closed on
Jul 10, 2017
Sold by
Blackburn Debra S
Bought by
Fogle Mary Rose
Purchase Details
Closed on
Jul 21, 2016
Sold by
Kayla L
Bought by
Blackburn Debra S
Purchase Details
Closed on
Sep 17, 2013
Sold by
Maples Brothers Constructi
Bought by
Fogle Kayla and Blackburn Debra
Purchase Details
Closed on
Sep 14, 2012
Sold by
Hall James H
Bought by
Maples Brothers Construction L
Create a Home Valuation Report for This Property
The Home Valuation Report is an in-depth analysis detailing your home's value as well as a comparison with similar homes in the area
Home Values in the Area
Average Home Value in this Area
Purchase History
| Date | Buyer | Sale Price | Title Company |
|---|---|---|---|
| Fogle Mary | -- | -- | |
| Serenity Jamarea Llc | -- | -- | |
| Fogle Mary Rose | -- | -- | |
| Blackburn Debra S | -- | -- | |
| Fogle Kayla | $83,000 | -- | |
| Maples Brothers Construction L | $9,500 | -- |
Source: Public Records
Tax History
| Year | Tax Paid | Tax Assessment Tax Assessment Total Assessment is a certain percentage of the fair market value that is determined by local assessors to be the total taxable value of land and additions on the property. | Land | Improvement |
|---|---|---|---|---|
| 2025 | $1,253 | $42,023 | $2,212 | $39,811 |
| 2024 | $1,417 | $36,992 | $1,748 | $35,244 |
| 2023 | $1,224 | $31,776 | $1,561 | $30,215 |
| 2022 | $856 | $31,776 | $1,561 | $30,215 |
| 2021 | $757 | $26,232 | $1,561 | $24,671 |
| 2020 | $702 | $26,232 | $1,561 | $24,671 |
| 2019 | $758 | $26,232 | $1,561 | $24,671 |
| 2018 | $1,097 | $26,232 | $1,561 | $24,671 |
| 2017 | $759 | $26,232 | $1,561 | $24,671 |
| 2016 | $760 | $26,232 | $1,561 | $24,671 |
| 2015 | $761 | $26,232 | $1,561 | $24,671 |
| 2014 | $762 | $26,232 | $1,561 | $24,671 |
| 2013 | -- | $1,560 | $1,560 | $0 |
Source: Public Records
Map
Nearby Homes
- 26 Haley Ct
- 27 Penny Dr Unit 27
- 27 Penny Dr
- Tract 5 Salem Church Rd
- Tract 3 Salem Church Rd
- 1864 Caulie Harris Rd
- 186 Jefferson Rd
- 187 Jefferson Rd
- 326 Barry Field Cir
- 338 Barry Field Cir
- 322 Barry Field Cir
- 330 Barry Field Cir
- 310 Barry Field Cir
- 343 McNeal Heritage Cir
- 233 Barry Field Cir
- 209 Barry Field Cir
- 200 McNeal Heritage Cir
- 220 Barry Field Cir
- 8009 Webb Rd N
- 355 McNeal Heritage Cir
- 502 Melody Cir
- 161 Wetherington St
- 192 Wetherington St
- 192 Wetherington St
- 141 Wetherington St
- 141 Wetherington St
- 431 Rountree St
- 397 Rountree St
- 25 Hinson
- 271 Wetherington
- 257 Williams
- 282 Wetherington St
- 25 Hinson St
- 376 E Roundtree St
- 192 Williams Rd
- 169 Fellowship Rd
- 40 Hinson St
- 66 Hinson St
- 126 Fellowship Rd
- 257 Williams St
Your Personal Tour Guide
Ask me questions while you tour the home.