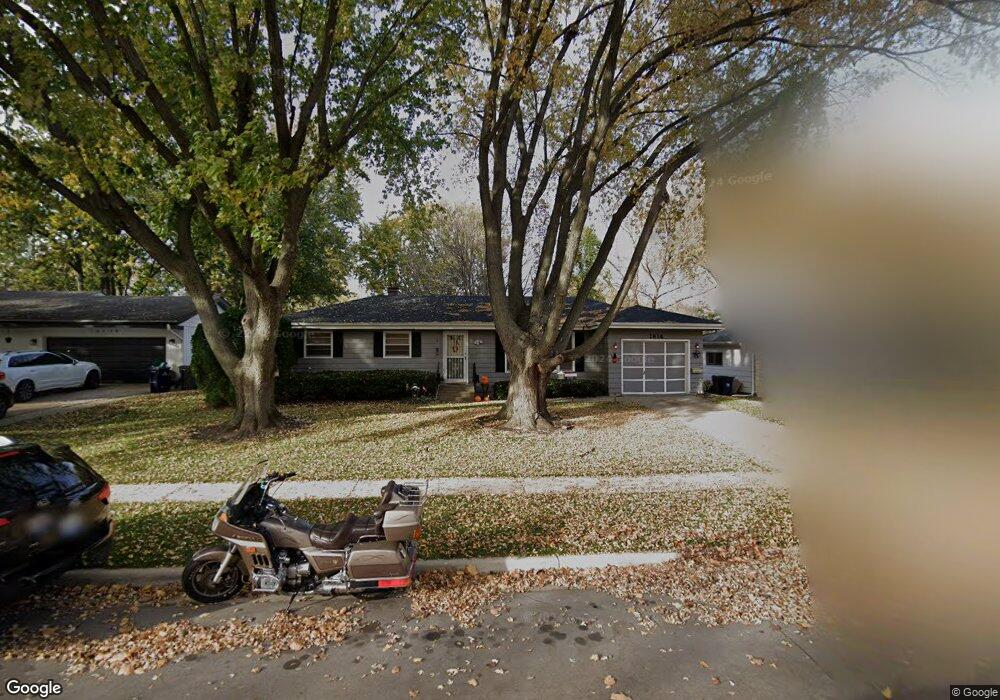
1814 Lin Lor Ln Elgin, IL 60123
North Country Knolls NeighborhoodEstimated Value: $277,425 - $314,000
3
Beds
1
Bath
989
Sq Ft
$298/Sq Ft
Est. Value
About This Home
This home is located at 1814 Lin Lor Ln, Elgin, IL 60123 and is currently estimated at $294,356, approximately $297 per square foot. 1814 Lin Lor Ln is a home located in Kane County with nearby schools including Hillcrest Elementary School, Kimball Middle School, and Larkin High School.
Ownership History
Date
Name
Owned For
Owner Type
Purchase Details
Closed on
Apr 16, 2008
Sold by
United Property Investments Llc
Bought by
Campbell Jeffrey J and Campbell Kelly L
Current Estimated Value
Home Financials for this Owner
Home Financials are based on the most recent Mortgage that was taken out on this home.
Original Mortgage
$191,002
Outstanding Balance
$120,423
Interest Rate
5.88%
Mortgage Type
FHA
Estimated Equity
$173,933
Purchase Details
Closed on
May 12, 2005
Sold by
Kiel Warren and Kiel Dorothy
Bought by
United Property Investments
Home Financials for this Owner
Home Financials are based on the most recent Mortgage that was taken out on this home.
Original Mortgage
$152,500
Interest Rate
6.5%
Mortgage Type
Purchase Money Mortgage
Purchase Details
Closed on
Jan 9, 2004
Sold by
Heine Ralph
Bought by
Kiel Warren and Kiel Dorothy
Home Financials for this Owner
Home Financials are based on the most recent Mortgage that was taken out on this home.
Original Mortgage
$153,000
Interest Rate
7.62%
Mortgage Type
Purchase Money Mortgage
Create a Home Valuation Report for This Property
The Home Valuation Report is an in-depth analysis detailing your home's value as well as a comparison with similar homes in the area
Home Values in the Area
Average Home Value in this Area
Purchase History
| Date | Buyer | Sale Price | Title Company |
|---|---|---|---|
| Campbell Jeffrey J | $194,000 | Ticor Title Insurance Co | |
| United Property Investments | $190,000 | First American Title Ins Co | |
| Kiel Warren | $170,000 | Chicago Title Insurance Comp |
Source: Public Records
Mortgage History
| Date | Status | Borrower | Loan Amount |
|---|---|---|---|
| Open | Campbell Jeffrey J | $191,002 | |
| Previous Owner | United Property Investments | $152,500 | |
| Previous Owner | Kiel Warren | $153,000 |
Source: Public Records
Tax History
| Year | Tax Paid | Tax Assessment Tax Assessment Total Assessment is a certain percentage of the fair market value that is determined by local assessors to be the total taxable value of land and additions on the property. | Land | Improvement |
|---|---|---|---|---|
| 2024 | $5,234 | $73,396 | $24,998 | $48,398 |
| 2023 | $4,970 | $66,308 | $22,584 | $43,724 |
| 2022 | $4,722 | $60,462 | $20,593 | $39,869 |
| 2021 | $4,508 | $56,528 | $19,253 | $37,275 |
| 2020 | $4,375 | $53,965 | $18,380 | $35,585 |
| 2019 | $4,241 | $51,405 | $17,508 | $33,897 |
| 2018 | $3,977 | $46,222 | $16,494 | $29,728 |
| 2017 | $3,877 | $43,697 | $15,593 | $28,104 |
| 2016 | $3,684 | $40,539 | $14,466 | $26,073 |
| 2015 | -- | $37,157 | $13,259 | $23,898 |
| 2014 | -- | $36,698 | $13,095 | $23,603 |
| 2013 | -- | $37,666 | $13,440 | $24,226 |
Source: Public Records
Map
Nearby Homes
- 92 N Airlite St
- 88 N Airlite St
- 1840 W Highland Ave Unit E-105
- 136 Mckinstry Dr
- 2022 Torino Dr
- 356 N Airlite St Unit 356
- 221 Heine Ave
- 2205 Country Knoll Ln
- 512 Shenandoah Trail
- 506 Shenandoah Trail
- 527 N Lyle Ave
- 530 Cumberland Trail
- 532 Shenandoah Trail
- 17 N Weston Ave
- 308 N Clifton Ave
- 1455 Erie St
- 70 S Weston Ave
- 1059 Larkin Ave
- 40 Acres Randall Rd
- 10N827 Hawthorne St
- 1800 Lin Lor Ln
- 1828 Lin Lor Ln
- 1823 Country Knoll Ln
- 1807 Country Knoll Ln
- 1790 Lin Lor Ln
- 1839 Country Knoll Ln
- 125 N Lyle Ave
- 1835 Lin Lor Ln
- 1791 Country Knoll Ln
- 1819 Lin Lor Ln
- 1805 Lin Lor Ln
- 1770 Lin Lor Ln Unit 9
- 1845 Country Knoll Ln
- 1771 Country Knoll Ln
- 1795 Lin Lor Ln
- 1750 Lin Lor Ln
- 1775 Lin Lor Ln
- 100 N Lyle Ave
- 1814 Country Knoll Ln
- 1828 Country Knoll Ln Unit 11
Your Personal Tour Guide
Ask me questions while you tour the home.