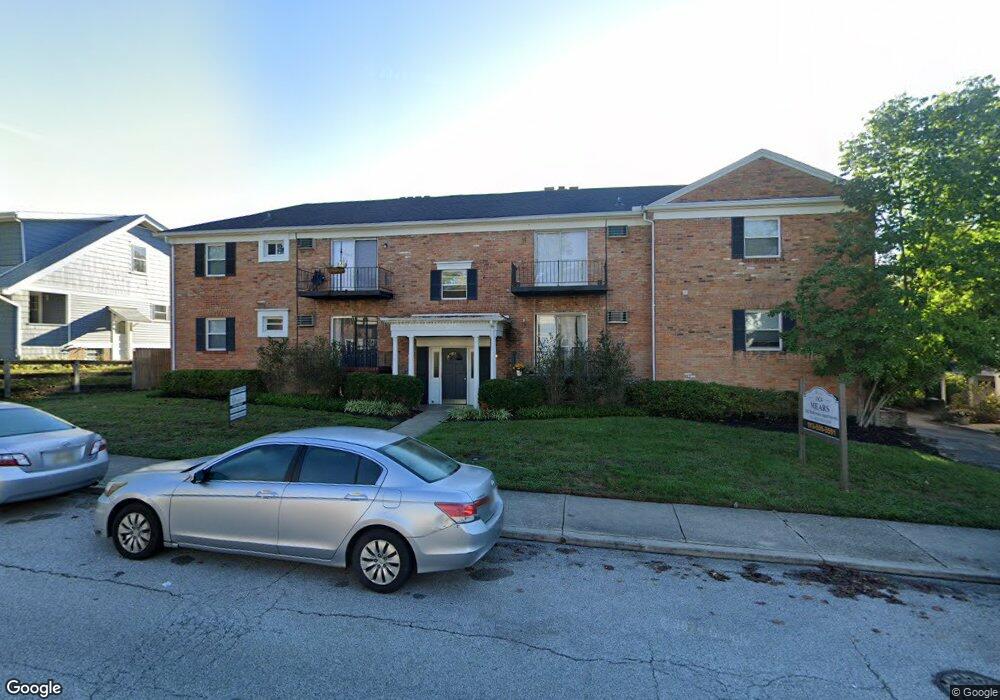
1824 Mears Ave Cincinnati, OH 45230
Mount Washington NeighborhoodAbout This Home
GARAGE PARKING AVAILABLE! This building is in the perfect location! These units are within a 15 minute drive to downtown Cincinnati, and minutes away from “The Mount Washington Water Tower District!” In The Water Tower District you can find various shops and food joints both local and chain. Mt. Washington is a family-friendly neighborhood that is right on the city limits. In less than 5 minutes you can reach the Mt. Washington Recreational Facility as well as Stanberry Park which provides some of the city’s most extensive hiking trails, playgrounds, picnic shelters, and premier sledding hills. From the newly updated kitchen and bathroom to the spacious bedroom as well as the added modern amenities, this is the perfect apartment for you.
Tenant pays a $49 (1 bed) & $99 (3 bed) water, sewer and trash utility fee. Electric is billed separately.
Home Values in the Area
Average Home Value in this Area
Property History
We collect this data history from publicly available records. To have your information removed, we recommend requesting removal directly through your county’s website.
| Date | Event | Price | List to Sale | Price per Sq Ft |
|---|---|---|---|---|
| 08/02/2025 08/02/25 | Off Market | $1,099 | -- | -- |
| 05/29/2025 05/29/25 | Price Changed | $1,099 | +18.8% | $1 / Sq Ft |
| 04/24/2025 04/24/25 | Price Changed | $925 | +5.7% | $1 / Sq Ft |
| 04/22/2025 04/22/25 | For Rent | $875 | 0.0% | -- |
| 04/15/2025 04/15/25 | Off Market | $875 | -- | -- |
| 03/15/2025 03/15/25 | For Rent | $875 | 0.0% | -- |
| 04/16/2024 04/16/24 | Price Changed | $875 | -2.7% | $1 / Sq Ft |
| 01/10/2024 01/10/24 | Price Changed | $899 | 0.0% | $1 / Sq Ft |
| 01/10/2024 01/10/24 | For Rent | $899 | -10.0% | -- |
| 02/23/2023 02/23/23 | Price Changed | $999 | +23.2% | $1 / Sq Ft |
| 12/22/2022 12/22/22 | Price Changed | $811 | -26.2% | $1 / Sq Ft |
| 12/21/2022 12/21/22 | For Rent | $1,099 | -- | -- |
Tax History
We collect this data history from publicly available records. To have your information removed, we recommend requesting removal directly through your county’s website.
| Year | Tax Paid | Tax Assessment Tax Assessment Total Assessment is a certain percentage of the fair market value that is determined by local assessors to be the total taxable value of land and additions on the property. | Land | Improvement |
|---|---|---|---|---|
| 2025 | $17,553 | $211,484 | $25,200 | $186,284 |
| 2024 | $17,435 | $211,484 | $25,200 | $186,284 |
| 2023 | $17,391 | $211,484 | $25,200 | $186,284 |
| 2022 | $16,866 | $185,857 | $25,060 | $160,797 |
| 2021 | $16,563 | $185,857 | $25,060 | $160,797 |
| 2020 | $16,581 | $185,857 | $25,060 | $160,797 |
| 2019 | $13,814 | $142,968 | $19,278 | $123,690 |
| 2018 | $13,821 | $142,968 | $19,278 | $123,690 |
| 2017 | $13,385 | $142,968 | $19,278 | $123,690 |
| 2016 | $16,216 | $169,768 | $18,053 | $151,715 |
| 2015 | $14,899 | $169,768 | $18,053 | $151,715 |
| 2014 | $14,949 | $169,768 | $18,053 | $151,715 |
| 2013 | $16,842 | $190,750 | $20,286 | $170,464 |
Map
- 1810 Wilaray Terrace
- 1647 Dell Terrace
- 1944 Rockland Ave
- 1944 Lehigh Ave
- 1735 Sutton Ave
- 1639 Sutton Ave
- 1983 Honeysuckle Ln
- 6193 Dawes Ln
- 6026 Colter Ave
- 1679 Brachman Ave
- 6355 Corbly Rd
- 6009 Wayside Ave
- 1508 Beth Ln
- 6001 Wayside Ave
- 1730 Bloomingdale Ave
- 2215 Salvador St
- 1414 Beacon Rd
- 6448 Craigland Ct
- 6023 Wayside Ct
- 6518 Waldorf Place
- 1802-1804 Mears Ave
- 1800 Mears Ave
- 1800 Mears Ave Unit 1
- 1742 Mears Ave
- 1802 Mears Ave
- 1816 Mears Ave
- 1820 Mears Ave
- 1803 Mears Ave
- 6241 Benneville St
- 1815 Mears Ave
- 6237 Benneville St Unit 1
- 6237 Benneville St
- 6245 Benneville St
- 1823 Mears Ave
- 1832 Mears Ave
- 6247 Benneville St
- 1737 Mears Ave
- 6249 Benneville St
- 6251 Benneville St
- 6253 Benneville St
Ask me questions while you tour the home.