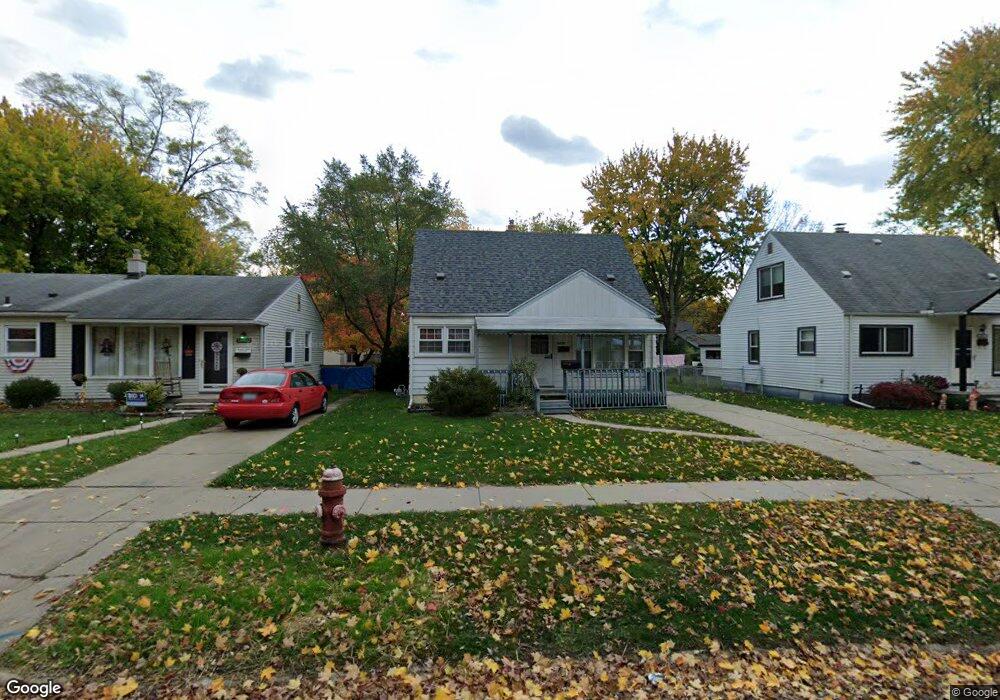
18298 Fox Redford, MI 48240
Estimated Value: $171,680 - $194,000
3
Beds
1
Bath
1,170
Sq Ft
$156/Sq Ft
Est. Value
About This Home
This home is located at 18298 Fox, Redford, MI 48240 and is currently estimated at $182,170, approximately $155 per square foot. 18298 Fox is a home located in Wayne County with nearby schools including Beech Elementary School, Hilbert Elementary School, and David Ellis Academy West.
Ownership History
Date
Name
Owned For
Owner Type
Purchase Details
Closed on
Nov 2, 2011
Sold by
Secretary Of Housing & Urban Development
Bought by
Salvador Lisa Rose
Current Estimated Value
Purchase Details
Closed on
Aug 16, 2011
Sold by
Jpmorgan Chase Bank National Association
Bought by
The Secretary Of Housing & Urban Develop
Purchase Details
Closed on
Jan 26, 2011
Sold by
Godfrey Kimberly S
Bought by
Chase Home Finance Llc
Purchase Details
Closed on
Jan 31, 2005
Sold by
Szekeres John and Szekeres Angela
Bought by
Godfrey Kimberly S
Create a Home Valuation Report for This Property
The Home Valuation Report is an in-depth analysis detailing your home's value as well as a comparison with similar homes in the area
Home Values in the Area
Average Home Value in this Area
Purchase History
| Date | Buyer | Sale Price | Title Company |
|---|---|---|---|
| Salvador Lisa Rose | $28,500 | None Available | |
| The Secretary Of Housing & Urban Develop | -- | None Available | |
| Chase Home Finance Llc | $140,449 | None Available | |
| Godfrey Kimberly S | $136,900 | Multiple |
Source: Public Records
Tax History
| Year | Tax Paid | Tax Assessment Tax Assessment Total Assessment is a certain percentage of the fair market value that is determined by local assessors to be the total taxable value of land and additions on the property. | Land | Improvement |
|---|---|---|---|---|
| 2025 | $812 | $83,500 | $0 | $0 |
| 2024 | $789 | $76,300 | $0 | $0 |
| 2023 | $753 | $65,900 | $0 | $0 |
| 2022 | $1,884 | $57,600 | $0 | $0 |
| 2021 | $1,831 | $54,800 | $0 | $0 |
| 2020 | $1,807 | $49,100 | $0 | $0 |
| 2019 | $1,768 | $41,000 | $0 | $0 |
| 2018 | $679 | $33,500 | $0 | $0 |
| 2017 | $1,752 | $31,100 | $0 | $0 |
| 2016 | $1,540 | $29,400 | $0 | $0 |
| 2015 | $2,438 | $26,700 | $0 | $0 |
| 2013 | $2,430 | $25,300 | $0 | $0 |
| 2012 | $1,690 | $28,600 | $7,200 | $21,400 |
Source: Public Records
Map
Nearby Homes
- 18678 Gaylord
- 18266 Macarthur
- 18705 Delaware Ave
- 18714 Gaylord
- 18441 Poinciana
- 18852 Indian
- 18410 Inkster Rd
- 18869 Indian
- 18719 Poinciana
- 17722 Kinloch
- 26305 W 7 Mile Rd Unit 101
- 26305 W 7 Mile Rd
- 26305 W 7 Mile Rd Unit 201
- 26850 W 7 Mile Rd
- 26415 W 7 Mile Rd Unit C218
- 18590 Pershing Ave
- 18570 Pershing St
- 19224 Denby
- 17198 Macarthur
- 00000 Centralia
Your Personal Tour Guide
Ask me questions while you tour the home.