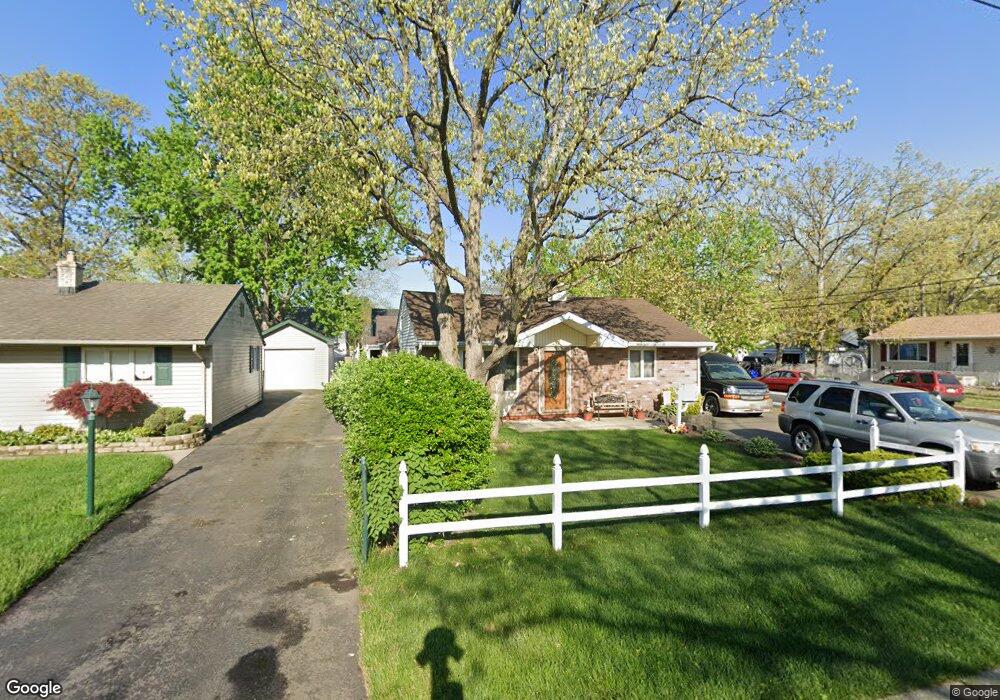
183 Austin Ave Old Bridge, NJ 08857
Estimated Value: $435,000 - $532,000
2
Beds
2
Baths
912
Sq Ft
$528/Sq Ft
Est. Value
About This Home
This home is located at 183 Austin Ave, Old Bridge, NJ 08857 and is currently estimated at $481,284, approximately $527 per square foot. 183 Austin Ave is a home located in Middlesex County with nearby schools including Old Bridge High School and St. Thomas the Apostle School.
Ownership History
Date
Name
Owned For
Owner Type
Purchase Details
Closed on
Aug 17, 2018
Sold by
Grima Albert and Grima Gloria
Bought by
Kinelski Donna Marie and Romano Mark E
Current Estimated Value
Home Financials for this Owner
Home Financials are based on the most recent Mortgage that was taken out on this home.
Original Mortgage
$279,837
Outstanding Balance
$243,027
Interest Rate
4.5%
Mortgage Type
FHA
Estimated Equity
$238,257
Purchase Details
Closed on
Aug 19, 1982
Bought by
Grima Albert and Grima Gloria
Create a Home Valuation Report for This Property
The Home Valuation Report is an in-depth analysis detailing your home's value as well as a comparison with similar homes in the area
Home Values in the Area
Average Home Value in this Area
Purchase History
We collect this data history from publicly available records. To have your information removed, we recommend requesting removal directly through your county’s website.
| Date | Buyer | Sale Price | Title Company |
|---|---|---|---|
| Kinelski Donna Marie | $286,000 | Old Republic Natl Title Ins | |
| Grima Albert | $63,900 | -- |
Source: Public Records
Mortgage History
We collect this data history from publicly available records. To have your information removed, we recommend requesting removal directly through your county’s website.
| Date | Status | Borrower | Loan Amount |
|---|---|---|---|
| Open | Kinelski Donna Marie | $279,837 |
Source: Public Records
Tax History
| Year | Tax Paid | Tax Assessment Tax Assessment Total Assessment is a certain percentage of the fair market value that is determined by local assessors to be the total taxable value of land and additions on the property. | Land | Improvement |
|---|---|---|---|---|
| 2025 | $5,489 | $97,200 | $44,000 | $53,200 |
| 2024 | $5,265 | $97,200 | $44,000 | $53,200 |
| 2023 | $5,265 | $97,200 | $44,000 | $53,200 |
| 2022 | $5,145 | $97,200 | $44,000 | $53,200 |
| 2021 | $3,776 | $97,200 | $44,000 | $53,200 |
| 2020 | $4,993 | $97,200 | $44,000 | $53,200 |
| 2019 | $4,909 | $97,200 | $44,000 | $53,200 |
| 2018 | $4,854 | $97,200 | $44,000 | $53,200 |
| 2017 | $4,697 | $97,200 | $44,000 | $53,200 |
| 2016 | $4,600 | $97,200 | $44,000 | $53,200 |
| 2015 | $4,520 | $97,200 | $44,000 | $53,200 |
| 2014 | $4,474 | $97,200 | $44,000 | $53,200 |
Source: Public Records
Map
Nearby Homes
- 296 Herbert Ave
- 219 Austin Ave
- 931 Englishtown Rd
- 857 Englishtown Rd
- 1210 Englishtown Rd
- 1212 Englishtown Rd
- 61 Sunset Ave
- 82 Madison Ave
- 52 Sunset Ave
- 110 Charles St
- 14 Madison Ave
- 41 Brookside Dr Ave
- 34 Brookside Ave
- 98 Madison Ave
- 47 Southwood Dr
- 14 Brookside Ave
- 14 Sunrise Rd
- 9 Harrison Ave
- 23 Orchard Dr
- 370 Marlboro Rd
Your Personal Tour Guide
Ask me questions while you tour the home.