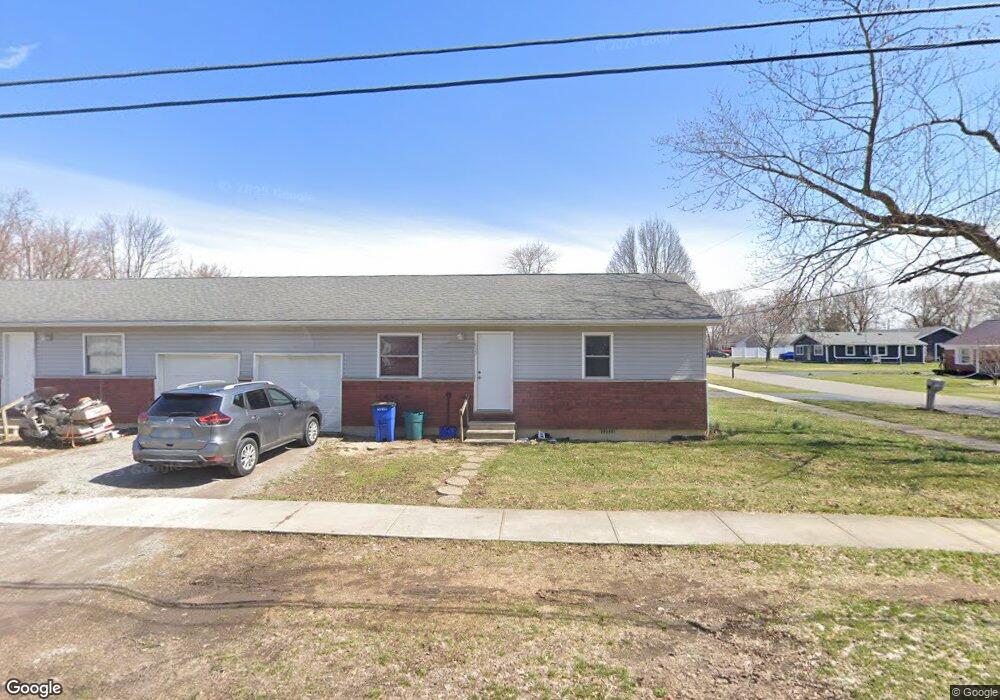
1831 - 1833 Harrison Findlay, OH 45840
Estimated Value: $141,000 - $647,619
4
Beds
2
Baths
1,600
Sq Ft
$177/Sq Ft
Est. Value
About This Home
This home is located at 1831 - 1833 Harrison, Findlay, OH 45840 and is currently estimated at $283,155, approximately $176 per square foot. 1831 - 1833 Harrison is a home located in Hancock County with nearby schools including Chamberlin Hill Elementary School, Jefferson Elementary School, and Donnell Middle School.
Ownership History
Date
Name
Owned For
Owner Type
Purchase Details
Closed on
May 14, 2015
Sold by
Olmstead Jason R
Bought by
K And S Properties Of Nortwest Ohio Llc
Current Estimated Value
Home Financials for this Owner
Home Financials are based on the most recent Mortgage that was taken out on this home.
Original Mortgage
$329,700
Outstanding Balance
$188,032
Interest Rate
3.68%
Mortgage Type
Credit Line Revolving
Estimated Equity
$95,123
Purchase Details
Closed on
Dec 3, 2013
Sold by
Olmstead Dennis and Olmstead Susan
Bought by
Olmstead Jason R
Purchase Details
Closed on
May 25, 2010
Sold by
Fannie Mae
Bought by
Olmstead Dennis and Olmstead Susan
Purchase Details
Closed on
Apr 22, 2010
Sold by
Heath Timothy S
Bought by
Federal National Mortgage Association
Purchase Details
Closed on
Jun 23, 1989
Bought by
Sanchez Esperanza
Purchase Details
Closed on
Jun 9, 1986
Bought by
Sanchez Ramon
Purchase Details
Closed on
Aug 1, 1984
Bought by
Lunn Gloria Y
Create a Home Valuation Report for This Property
The Home Valuation Report is an in-depth analysis detailing your home's value as well as a comparison with similar homes in the area
Home Values in the Area
Average Home Value in this Area
Purchase History
| Date | Buyer | Sale Price | Title Company |
|---|---|---|---|
| K And S Properties Of Nortwest Ohio Llc | $350,000 | Mid Am Title | |
| Olmstead Jason R | $46,767 | None Available | |
| Olmstead Dennis | $46,766 | Heartland Title Agency | |
| Federal National Mortgage Association | $43,334 | None Available | |
| Sanchez Esperanza | -- | -- | |
| Sanchez Ramon | $2,000 | -- | |
| Lunn Gloria Y | $1,000 | -- |
Source: Public Records
Mortgage History
| Date | Status | Borrower | Loan Amount |
|---|---|---|---|
| Open | K And S Properties Of Nortwest Ohio Llc | $329,700 |
Source: Public Records
Map
Nearby Homes
- 1898 Baker Way Unit 18
- 0 Bushwillow Dr Unit Lot 154
- 0 Bushwillow Dr Lot 156 Unit 6079046
- 0 Rock Candy Rd Lot 162 Unit 6079070
- 0 Bushwillow Dr Unit Lot 156
- 0 Bearcat Way Or 0 Rock Candy Rd Lot 167 Unit 6079083
- 0 Bushwillow Dr Lot 154 Unit 6079043
- 0 Rock Candy Rd Lot 171 Unit 6079088
- 0 County Road 99 Lot 2 Unit 6081480
- 0 Rock Candy Rd Lot 159 Unit 6079053
- 0 Bushwillow Dr Or Rock Candy Rd Lot 157 Unit 6079052
- 0 Bushwillow Dr Unit Lot 155
- 0 Rock Candy Rd Or Bushwillow Dr Lot 173 Unit 6079093
- 0 Rock Candy Rd Lot 168 Unit 6079085
- 0 Rock Candy Rd Lot 170 Unit 6079087
- 0 Bushwillow Dr Lot 155 Unit 6079044
- 1401 Logan Ave
- 1604 Gray St
- 0 Waterford Way Lot 78 Unit 6089639
- 10601 County Road 9
- 1831 Harrison St
- 1833 Harrison St
- 1748 Carey Ave
- 1740 Carey Ave
- 1850 Harrison St
- 1728 Harrison St
- 1730 Harrison St
- 1738 Carey Ave
- 1745 Carey Ave
- 1807 Bliss Ave
- 1741 Carey Ave
- 1811 Carey Ave
- 1724 Carey Ave
- 1817 Bliss Ave
- 1735 Carey Ave
- 1720 Carey Ave
- 1815 Harrison St
- 1644 Olney Ave
- 1825 Bliss Ave
- 1716 Carey Ave
Your Personal Tour Guide
Ask me questions while you tour the home.