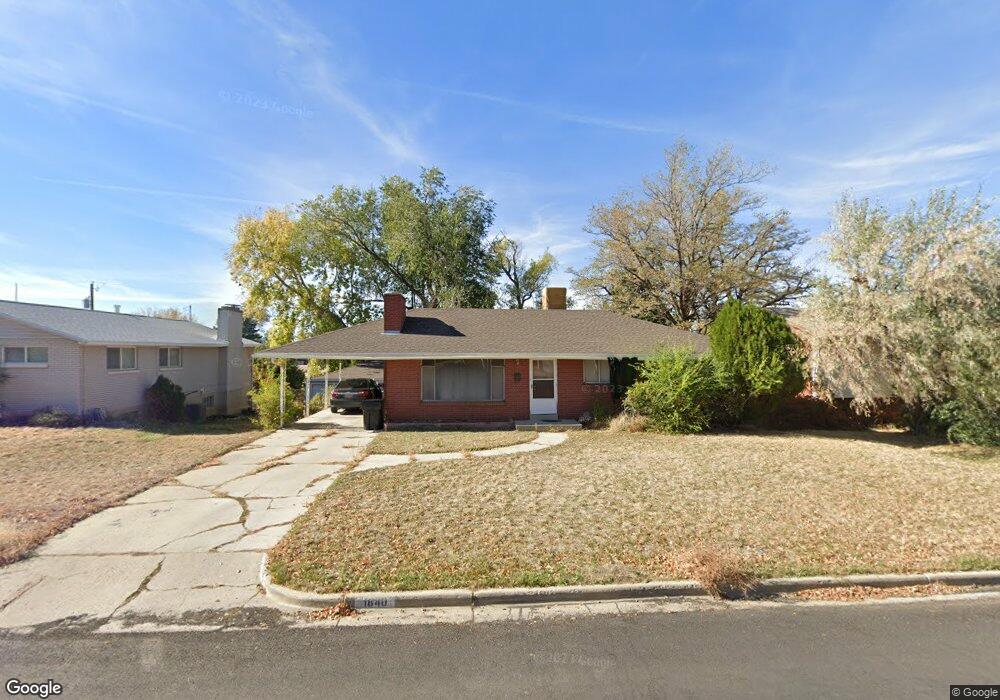
1840 S 200 E Bountiful, UT 84010
Estimated Value: $500,000 - $540,000
4
Beds
2
Baths
2,436
Sq Ft
$215/Sq Ft
Est. Value
About This Home
This home is located at 1840 S 200 E, Bountiful, UT 84010 and is currently estimated at $523,443, approximately $214 per square foot. 1840 S 200 E is a home located in Davis County with nearby schools including Muir School, Mueller Park Junior High School, and Bountiful High School.
Ownership History
Date
Name
Owned For
Owner Type
Purchase Details
Closed on
Jul 7, 2023
Sold by
Cassun Family Partnership
Bought by
Haacke Christopher and Rubliar Marla Fernanda
Current Estimated Value
Home Financials for this Owner
Home Financials are based on the most recent Mortgage that was taken out on this home.
Original Mortgage
$448,721
Outstanding Balance
$437,407
Interest Rate
6.71%
Mortgage Type
FHA
Estimated Equity
$86,036
Purchase Details
Closed on
Mar 11, 2016
Sold by
Cassun William C
Bought by
Cassun Family Partnership
Create a Home Valuation Report for This Property
The Home Valuation Report is an in-depth analysis detailing your home's value as well as a comparison with similar homes in the area
Purchase History
| Date | Buyer | Sale Price | Title Company |
|---|---|---|---|
| Haacke Christopher | -- | Highland Title | |
| Cassun Family Partnership | -- | None Available |
Source: Public Records
Mortgage History
| Date | Status | Borrower | Loan Amount |
|---|---|---|---|
| Open | Haacke Christopher | $448,721 |
Source: Public Records
Tax History
| Year | Tax Paid | Tax Assessment Tax Assessment Total Assessment is a certain percentage of the fair market value that is determined by local assessors to be the total taxable value of land and additions on the property. | Land | Improvement |
|---|---|---|---|---|
| 2025 | $2,790 | $252,451 | $109,511 | $142,940 |
| 2024 | $2,592 | $243,650 | $96,989 | $146,661 |
| 2023 | $2,487 | $233,200 | $98,599 | $134,600 |
| 2022 | $2,600 | $443,000 | $178,394 | $264,606 |
| 2021 | $2,314 | $331,000 | $128,373 | $202,627 |
| 2020 | $2,051 | $294,000 | $109,869 | $184,131 |
| 2019 | $2,077 | $291,000 | $117,472 | $173,528 |
| 2018 | $1,931 | $266,000 | $115,184 | $150,816 |
| 2016 | $1,584 | $117,590 | $40,239 | $77,351 |
| 2015 | $1,558 | $109,230 | $40,239 | $68,991 |
| 2014 | $1,606 | $116,327 | $40,239 | $76,088 |
| 2013 | -- | $96,774 | $51,700 | $45,074 |
Source: Public Records
Map
Nearby Homes
- 188 E 2050 S Unit D3
- 296 E 2050 S Unit 2
- 2038 S 350 E Unit 3
- 2064 S Orchard Dr
- 2059 S 350 E Unit 6
- 2046 S 350 E Unit 4
- 295 E 2050 S Unit 1
- 2053 S 350 E Unit 7
- 141 E 1650 S
- 320 E 2100 S
- 2 E Wicker Ln
- 1886 S Jeri Dr
- 1820 S 50 W
- 2273 S 200 E
- 41 E 2200 S
- 110 2250 S
- 380 E 1500 S
- 2292 S 250 E
- 631 E 1700 S
- 190 W 1800 S
Your Personal Tour Guide
Ask me questions while you tour the home.