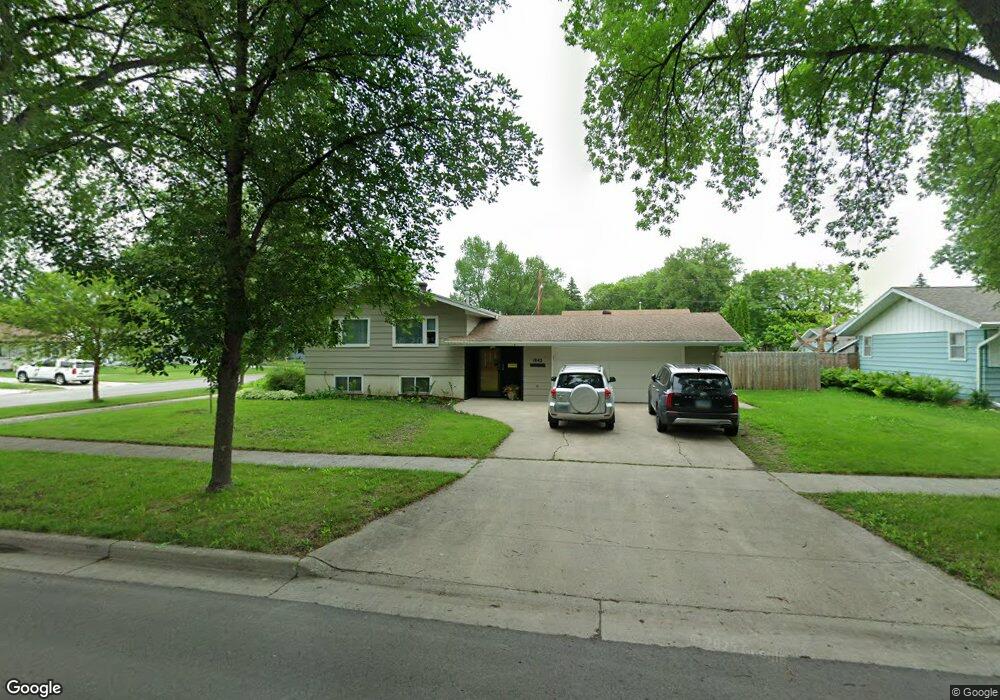
1843 4th St N Fargo, ND 58102
Washington NeighborhoodEstimated Value: $308,758 - $317,000
5
Beds
2
Baths
2,510
Sq Ft
$125/Sq Ft
Est. Value
About This Home
This home is located at 1843 4th St N, Fargo, ND 58102 and is currently estimated at $313,940, approximately $125 per square foot. 1843 4th St N is a home located in Cass County with nearby schools including Washington Elementary School, Ben Franklin Middle School, and North High School.
Ownership History
Date
Name
Owned For
Owner Type
Purchase Details
Closed on
Mar 9, 2020
Sold by
Barke Joanne E and Barke Christine Wallace
Bought by
Cianci Thomas P and Cianci Megaan J
Current Estimated Value
Home Financials for this Owner
Home Financials are based on the most recent Mortgage that was taken out on this home.
Original Mortgage
$197,600
Outstanding Balance
$130,014
Interest Rate
3.6%
Mortgage Type
New Conventional
Estimated Equity
$183,926
Purchase Details
Closed on
Apr 24, 2006
Sold by
Barke Christie Wallace and Barke Joanne E
Bought by
Barke Christie Wallace and Barke Joanne E
Create a Home Valuation Report for This Property
The Home Valuation Report is an in-depth analysis detailing your home's value as well as a comparison with similar homes in the area
Home Values in the Area
Average Home Value in this Area
Purchase History
| Date | Buyer | Sale Price | Title Company |
|---|---|---|---|
| Cianci Thomas P | $247,000 | Plains Title Llc | |
| Barke Christie Wallace | -- | -- |
Source: Public Records
Mortgage History
| Date | Status | Borrower | Loan Amount |
|---|---|---|---|
| Open | Cianci Thomas P | $197,600 |
Source: Public Records
Tax History
| Year | Tax Paid | Tax Assessment Tax Assessment Total Assessment is a certain percentage of the fair market value that is determined by local assessors to be the total taxable value of land and additions on the property. | Land | Improvement |
|---|---|---|---|---|
| 2025 | $6,523 | $138,750 | $31,750 | $107,000 |
| 2024 | $4,817 | $134,100 | $36,050 | $98,050 |
| 2023 | $4,565 | $125,350 | $36,050 | $89,300 |
| 2022 | $4,553 | $122,900 | $36,050 | $86,850 |
| 2021 | $4,308 | $115,950 | $36,050 | $79,900 |
| 2020 | $4,267 | $115,950 | $36,050 | $79,900 |
| 2019 | $4,270 | $115,950 | $21,400 | $94,550 |
| 2018 | $3,037 | $98,000 | $21,400 | $76,600 |
| 2017 | $3,334 | $91,600 | $21,400 | $70,200 |
| 2016 | $3,299 | $91,600 | $21,400 | $70,200 |
| 2015 | $2,187 | $91,600 | $14,650 | $76,950 |
| 2014 | $3,466 | $90,200 | $14,650 | $75,550 |
| 2013 | $3,316 | $84,300 | $14,650 | $69,650 |
Source: Public Records
Map
Nearby Homes
- 1841 3rd St N
- 305 21st Ave N
- 301 21st Ave N
- 101 19th Ave N
- 77 18th Ave N
- 3216 Broadway N
- 1647 Broadway N
- 801 17th Ave N
- 306 25th Ave N
- 1630 7th St N
- 1731 Elm St N
- 105 24th Ave N
- 2301 9th St N
- 77 23rd Ave N
- 2501 9th St N
- 1542 8th St N
- 1613 10th St N
- 1441 Broadway N Unit 203
- 1437 Broadway N Unit 101
- 2807 Edgewood Dr N
Your Personal Tour Guide
Ask me questions while you tour the home.