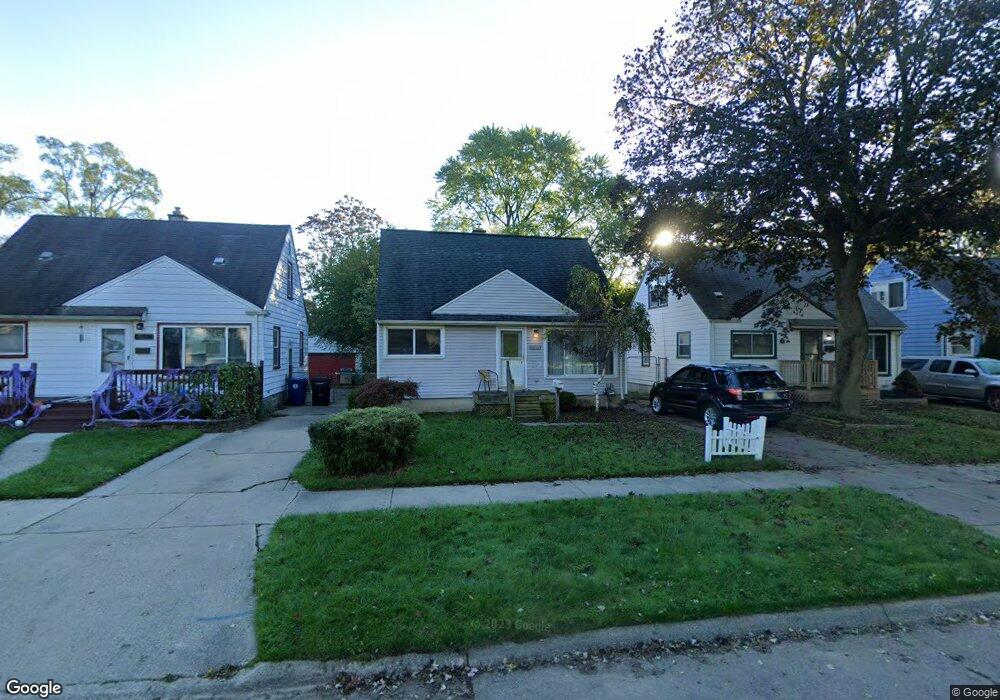
18442 Denby Redford, MI 48240
Estimated Value: $145,000 - $191,000
3
Beds
2
Baths
1,350
Sq Ft
$128/Sq Ft
Est. Value
About This Home
This home is located at 18442 Denby, Redford, MI 48240 and is currently estimated at $172,651, approximately $127 per square foot. 18442 Denby is a home located in Wayne County with nearby schools including Beech Elementary School, Hilbert Elementary School, and David Ellis Academy West.
Ownership History
Date
Name
Owned For
Owner Type
Purchase Details
Closed on
Dec 10, 2012
Sold by
Saulson Eli and Saulson Michele
Bought by
18442 Denby Llc
Current Estimated Value
Purchase Details
Closed on
Nov 27, 2012
Sold by
Clark Rachel L
Bought by
Saulson Eli
Purchase Details
Closed on
Apr 28, 2004
Sold by
Elkins Linda E and Girolamo Linda E
Bought by
Clark Rachel L
Home Financials for this Owner
Home Financials are based on the most recent Mortgage that was taken out on this home.
Original Mortgage
$120,650
Interest Rate
5.63%
Mortgage Type
Purchase Money Mortgage
Purchase Details
Closed on
May 27, 1998
Sold by
Anthony Mary E and Anthony Rick
Bought by
Girolamo Linda E
Create a Home Valuation Report for This Property
The Home Valuation Report is an in-depth analysis detailing your home's value as well as a comparison with similar homes in the area
Home Values in the Area
Average Home Value in this Area
Purchase History
| Date | Buyer | Sale Price | Title Company |
|---|---|---|---|
| 18442 Denby Llc | -- | None Available | |
| Saulson Eli | $38,000 | Interstate Title Inc | |
| Clark Rachel L | $127,000 | Moon Title | |
| Girolamo Linda E | $91,000 | -- |
Source: Public Records
Mortgage History
| Date | Status | Borrower | Loan Amount |
|---|---|---|---|
| Previous Owner | Clark Rachel L | $120,650 |
Source: Public Records
Tax History
| Year | Tax Paid | Tax Assessment Tax Assessment Total Assessment is a certain percentage of the fair market value that is determined by local assessors to be the total taxable value of land and additions on the property. | Land | Improvement |
|---|---|---|---|---|
| 2025 | $1,366 | $85,400 | $0 | $0 |
| 2024 | $1,331 | $78,000 | $0 | $0 |
| 2023 | $1,283 | $67,100 | $0 | $0 |
| 2022 | $2,397 | $58,500 | $0 | $0 |
| 2021 | $2,334 | $55,500 | $0 | $0 |
| 2020 | $2,302 | $50,400 | $0 | $0 |
| 2019 | $2,254 | $42,000 | $0 | $0 |
| 2018 | $1,146 | $34,200 | $0 | $0 |
| 2017 | $1,766 | $31,700 | $0 | $0 |
| 2016 | $2,001 | $30,100 | $0 | $0 |
| 2015 | $2,459 | $27,100 | $0 | $0 |
| 2013 | $2,360 | $24,500 | $0 | $0 |
| 2012 | $1,661 | $27,900 | $6,200 | $21,700 |
Source: Public Records
Map
Nearby Homes
- 18455 Denby
- 18653 Indian
- 18441 Poinciana
- 18678 Gaylord
- 18714 Gaylord
- 18852 Indian
- 18719 Poinciana
- 18705 Delaware Ave
- 18869 Indian
- 18410 Inkster Rd
- 26850 W 7 Mile Rd
- 18266 Macarthur
- 18570 Pershing St
- 18590 Pershing Ave
- 26415 W 7 Mile Rd Unit C218
- 26305 W 7 Mile Rd Unit 101
- 26305 W 7 Mile Rd Unit 206
- 26305 W 7 Mile Rd Unit 201
- 18411 Foch St
- 26346 Seven Mile W
Your Personal Tour Guide
Ask me questions while you tour the home.