Estimated Value: $174,000 - $246,000
4
Beds
2
Baths
2,688
Sq Ft
$74/Sq Ft
Est. Value
About This Home
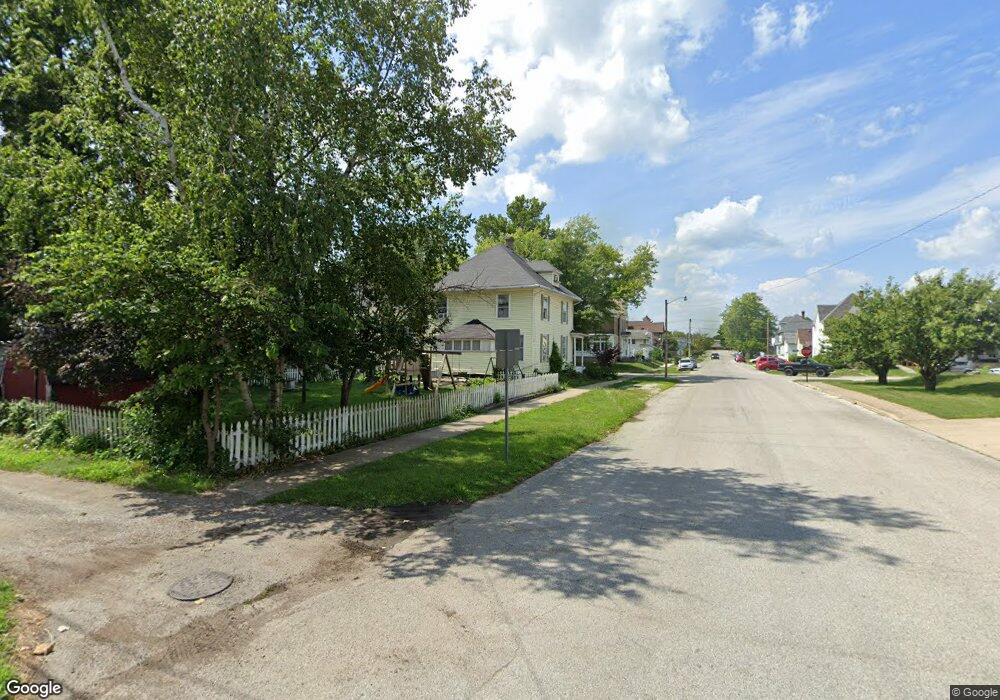
This home is located at 185 E 5th St, Peru, IN 46970 and is currently estimated at $199,937, approximately $74 per square foot. 185 E 5th St is a home located in Miami County with nearby schools including Elmwood Primary Learning Center, Blair Pointe Upper Elementary School, and Peru Junior/High School.
Ownership History
Date
Name
Owned For
Owner Type
Purchase Details
Closed on
Oct 23, 2015
Sold by
Sherwin Sandra
Bought by
Thompson Adam J
Current Estimated Value
Home Financials for this Owner
Home Financials are based on the most recent Mortgage that was taken out on this home.
Original Mortgage
$87,300
Outstanding Balance
$67,809
Interest Rate
3.91%
Mortgage Type
New Conventional
Estimated Equity
$132,128
Purchase Details
Closed on
May 11, 2007
Sold by
Fannie Mae
Bought by
Lester Joseph R and Lester Kerri L
Purchase Details
Closed on
Oct 31, 2006
Sold by
Hipsher William H and Hipsher Constance J
Bought by
Federal National Mortgage Association
Create a Home Valuation Report for This Property
The Home Valuation Report is an in-depth analysis detailing your home's value as well as a comparison with similar homes in the area
Home Values in the Area
Average Home Value in this Area
Purchase History
| Date | Buyer | Sale Price | Title Company |
|---|---|---|---|
| Thompson Adam J | -- | None Available | |
| Lester Joseph R | -- | None Available | |
| Federal National Mortgage Association | $111,963 | None Available |
Source: Public Records
Mortgage History
| Date | Status | Borrower | Loan Amount |
|---|---|---|---|
| Open | Thompson Adam J | $87,300 |
Source: Public Records
Tax History
| Year | Tax Paid | Tax Assessment Tax Assessment Total Assessment is a certain percentage of the fair market value that is determined by local assessors to be the total taxable value of land and additions on the property. | Land | Improvement |
|---|---|---|---|---|
| 2025 | $1,507 | $173,800 | $6,200 | $167,600 |
| 2024 | $1,507 | $150,700 | $6,200 | $144,500 |
| 2023 | $1,507 | $141,300 | $6,200 | $135,100 |
| 2022 | $1,024 | $104,500 | $6,200 | $98,300 |
| 2021 | $944 | $96,400 | $6,200 | $90,200 |
| 2020 | $944 | $96,400 | $6,200 | $90,200 |
| 2019 | $961 | $96,400 | $6,200 | $90,200 |
| 2018 | $641 | $82,300 | $6,200 | $76,100 |
| 2017 | $586 | $81,600 | $6,200 | $75,400 |
| 2016 | $763 | $81,700 | $6,200 | $75,500 |
| 2014 | $333 | $70,100 | $6,200 | $63,900 |
| 2013 | -- | $69,300 | $6,200 | $63,100 |
Source: Public Records
Map
Nearby Homes
Your Personal Tour Guide
Ask me questions while you tour the home.