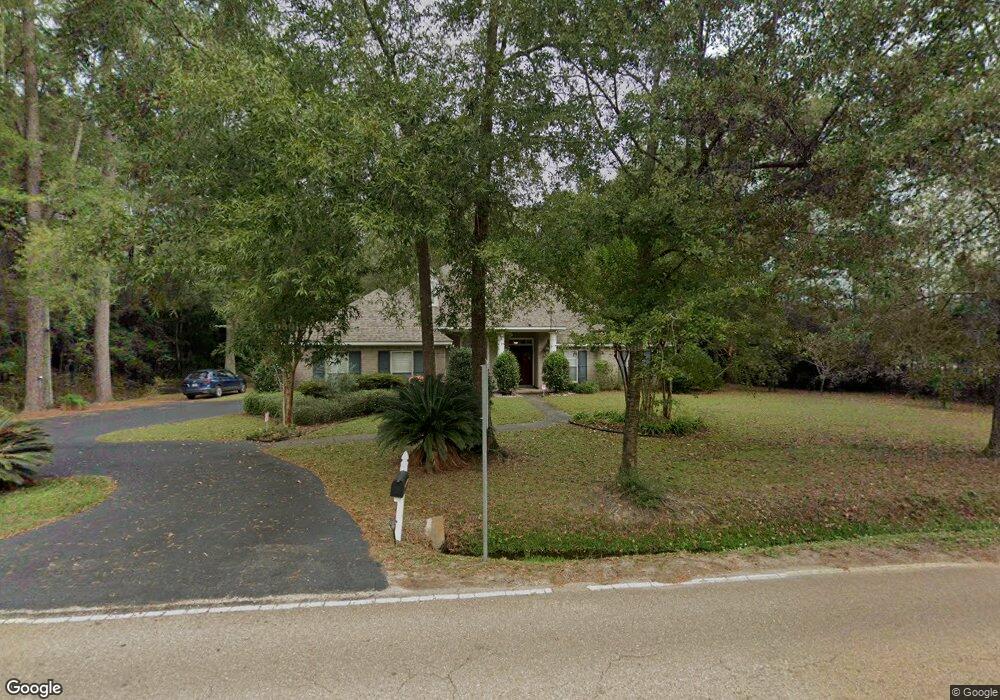
1859 Viola St Mandeville, LA 70448
Estimated Value: $501,000 - $606,000
4
Beds
3
Baths
3,847
Sq Ft
$149/Sq Ft
Est. Value
About This Home
This home is located at 1859 Viola St, Mandeville, LA 70448 and is currently estimated at $572,876, approximately $148 per square foot. 1859 Viola St is a home located in St. Tammany Parish with nearby schools including Marigny Elementary School, Lake Harbor Middle School, and Magnolia Trace Elementary School.
Ownership History
Date
Name
Owned For
Owner Type
Purchase Details
Closed on
Feb 1, 2011
Sold by
Lagarrigue Alain Schroeder and Lagarrigue Gerard Michael
Bought by
Larocca Carol M and Patrick Larocca Ra Mond
Current Estimated Value
Home Financials for this Owner
Home Financials are based on the most recent Mortgage that was taken out on this home.
Original Mortgage
$245,581
Interest Rate
4.5%
Mortgage Type
FHA
Create a Home Valuation Report for This Property
The Home Valuation Report is an in-depth analysis detailing your home's value as well as a comparison with similar homes in the area
Home Values in the Area
Average Home Value in this Area
Purchase History
| Date | Buyer | Sale Price | Title Company |
|---|---|---|---|
| Larocca Carol M | $307,000 | None Available |
Source: Public Records
Mortgage History
| Date | Status | Borrower | Loan Amount |
|---|---|---|---|
| Closed | Larocca Carol M | $245,581 |
Source: Public Records
Tax History
| Year | Tax Paid | Tax Assessment Tax Assessment Total Assessment is a certain percentage of the fair market value that is determined by local assessors to be the total taxable value of land and additions on the property. | Land | Improvement |
|---|---|---|---|---|
| 2025 | $3,875 | $39,801 | $4,635 | $35,166 |
| 2024 | $3,875 | $39,801 | $4,635 | $35,166 |
| 2023 | $4,018 | $32,933 | $4,635 | $28,298 |
| 2022 | $337,113 | $32,933 | $4,635 | $28,298 |
| 2021 | $3,365 | $32,933 | $4,635 | $28,298 |
| 2020 | $3,361 | $32,933 | $4,635 | $28,298 |
| 2019 | $4,383 | $31,974 | $4,500 | $27,474 |
| 2018 | $4,390 | $31,974 | $4,500 | $27,474 |
| 2017 | $4,431 | $31,974 | $4,500 | $27,474 |
| 2016 | $4,465 | $31,974 | $4,500 | $27,474 |
| 2015 | $3,240 | $30,083 | $4,500 | $25,583 |
| 2014 | $3,206 | $30,083 | $4,500 | $25,583 |
| 2013 | -- | $30,083 | $4,500 | $25,583 |
Source: Public Records
Map
Nearby Homes
Your Personal Tour Guide
Ask me questions while you tour the home.