186 Mansion Rd Wallingford, CT 06492
Estimated Value: $402,000 - $419,000
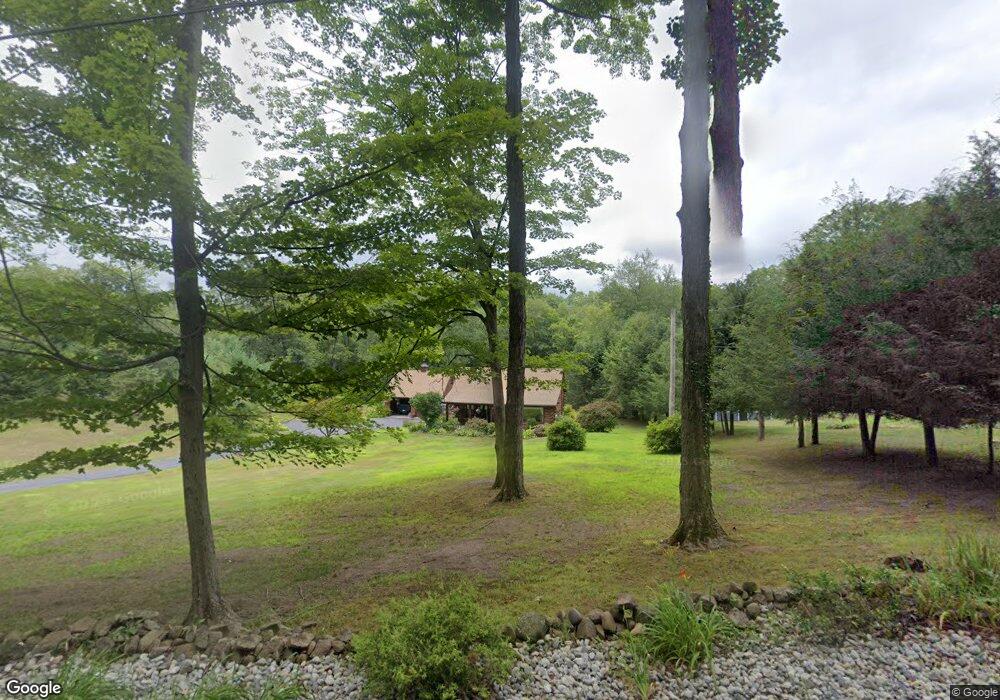
About This Home
This home is located at 186 Mansion Rd, Wallingford, CT 06492 and is currently estimated at $411,560, approximately $342 per square foot. 186 Mansion Rd is a home located in New Haven County with nearby schools including Evarts C. Stevens School, Parker Farms School, and James H. Moran Middle School.
Ownership History
We collect this data history from publicly available records. To have your information removed, we recommend requesting removal directly through your county’s website.
Purchase Details
Purchase Details
Home Values in the Area
Average Home Value in this Area
Purchase History
We collect this data history from publicly available records. To have your information removed, we recommend requesting removal directly through your county’s website.
| Date | Buyer | Sale Price | Title Company |
|---|---|---|---|
| -- | None Available | ||
| -- | -- |
Mortgage History
We collect this data history from publicly available records. To have your information removed, we recommend requesting removal directly through your county’s website.
| Date | Status | Borrower | Loan Amount |
|---|---|---|---|
| Previous Owner | $90,000 | ||
| Previous Owner | $22,000 |
Tax History
We collect this data history from publicly available records. To have your information removed, we recommend requesting removal directly through your county’s website.
| Year | Tax Paid | Tax Assessment Tax Assessment Total Assessment is a certain percentage of the fair market value that is determined by local assessors to be the total taxable value of land and additions on the property. | Land | Improvement |
|---|---|---|---|---|
| 2025 | $6,160 | $255,400 | $106,900 | $148,500 |
| 2024 | $5,580 | $182,000 | $89,100 | $92,900 |
| 2023 | $5,340 | $182,000 | $89,100 | $92,900 |
| 2022 | $5,285 | $182,000 | $89,100 | $92,900 |
| 2021 | $5,191 | $182,000 | $89,100 | $92,900 |
| 2020 | $5,353 | $183,400 | $98,000 | $85,400 |
| 2019 | $5,353 | $183,400 | $98,000 | $85,400 |
| 2018 | $5,253 | $183,400 | $98,000 | $85,400 |
| 2017 | $5,236 | $183,400 | $98,000 | $85,400 |
| 2016 | $5,115 | $183,400 | $98,000 | $85,400 |
| 2015 | $5,068 | $184,500 | $98,000 | $86,500 |
| 2014 | $4,961 | $184,500 | $98,000 | $86,500 |
Map
- 4 Ortense Dr
- 9 Balsam Ridge Cir
- 77 School House Rd
- 735 Cook Hill Rd
- 1500 Rhey Ave
- 58 School House Rd
- 43 Bruschayt Dr
- 55 Hallmark Hill Dr Unit 55
- 136 Knoll Dr
- 1460 Mount Carmel Ave
- 36R Nod Brook Rd
- 101 Summerhill Rd Unit 101
- 167 Summerhill Rd Unit 167
- 129 Brentwood Dr
- 111 Strathmore Ln Unit 111
- 221 Brentwood Dr
- 21 Lost Brook Ln
- 1 Catherine Ct Unit B
- 6 Mount Sanford Rd
- 5 Pondside Place
Ask me questions while you tour the home.