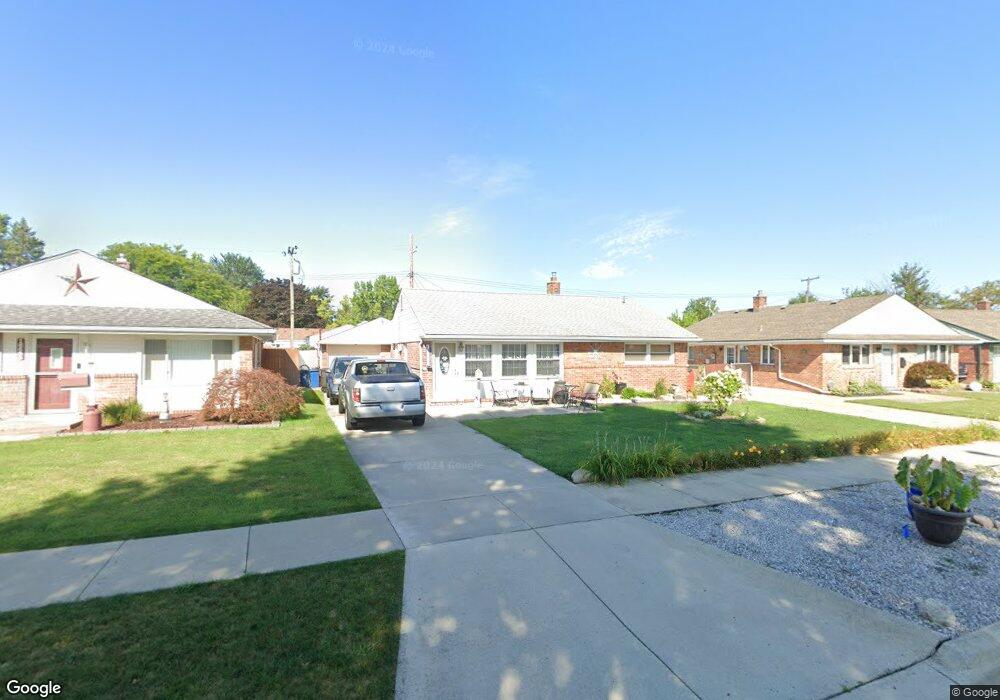
18620 Marsha St Riverview, MI 48193
Estimated Value: $161,000 - $191,000
3
Beds
1
Bath
1,036
Sq Ft
$174/Sq Ft
Est. Value
About This Home
This home is located at 18620 Marsha St, Riverview, MI 48193 and is currently estimated at $180,262, approximately $173 per square foot. 18620 Marsha St is a home located in Wayne County with nearby schools including Riverview Community High School and St. Cyprian Elementary School.
Ownership History
Date
Name
Owned For
Owner Type
Purchase Details
Closed on
Dec 28, 2011
Sold by
Owens Daniel B and Okray Leona A
Bought by
Owens Daniel B and Breiter Kathleen R
Current Estimated Value
Purchase Details
Closed on
May 13, 2011
Sold by
Lothian Randolph
Bought by
Owens Daniel B and Okray Leona
Purchase Details
Closed on
Feb 17, 2010
Sold by
Pattenaude Joseph
Bought by
Federal Home Loan Mortgage Corp
Purchase Details
Closed on
Mar 31, 2006
Sold by
Mann Albert G and Mann Jeffrey E
Bought by
Pattenaude Joseph
Purchase Details
Closed on
Apr 15, 1999
Sold by
Mann Albert E
Bought by
Mann Albert G
Create a Home Valuation Report for This Property
The Home Valuation Report is an in-depth analysis detailing your home's value as well as a comparison with similar homes in the area
Home Values in the Area
Average Home Value in this Area
Purchase History
We collect this data history from publicly available records. To have your information removed, we recommend requesting removal directly through your county’s website.
| Date | Buyer | Sale Price | Title Company |
|---|---|---|---|
| Owens Daniel B | -- | None Available | |
| Owens Daniel B | $60,000 | Attorneys Title Agency Llc | |
| Federal Home Loan Mortgage Corp | $85,813 | None Available | |
| Pattenaude Joseph | $106,000 | Multiple | |
| Mann Albert G | -- | -- |
Source: Public Records
Tax History
| Year | Tax Paid | Tax Assessment Tax Assessment Total Assessment is a certain percentage of the fair market value that is determined by local assessors to be the total taxable value of land and additions on the property. | Land | Improvement |
|---|---|---|---|---|
| 2025 | $4,525 | $76,600 | $0 | $0 |
| 2024 | $1,885 | $72,800 | $0 | $0 |
| 2023 | $1,628 | $63,300 | $0 | $0 |
| 2022 | $2,351 | $56,500 | $0 | $0 |
| 2021 | $2,123 | $54,300 | $0 | $0 |
| 2020 | $1,925 | $50,400 | $0 | $0 |
| 2019 | $1,889 | $47,200 | $0 | $0 |
| 2018 | $1,354 | $44,100 | $0 | $0 |
| 2017 | $968 | $41,300 | $0 | $0 |
| 2016 | $1,633 | $40,300 | $0 | $0 |
| 2015 | $3,365 | $40,400 | $0 | $0 |
| 2013 | $3,260 | $33,200 | $0 | $0 |
| 2012 | $2,461 | $36,000 | $14,800 | $21,200 |
Source: Public Records
Map
Nearby Homes
- 18570 Matthews St
- 18271 Marsha St
- VACANT Sibley Rd
- 18217 Hamann St
- 45 Cleveland St
- 18082 Ray St
- 17812 Quarry Rd
- 214 Detroit St
- 0000 Fort St
- 331 Detroit St
- 17538 Matthews St
- 18576 Jefferson
- 13842 Heritage St
- 14018 Greentrees St
- 14262 Dundee St
- 14137 Berkshire St
- VL Pennsylvania Rd
- 14341 Heritage St
- 17836 Poplar St
- 14851 Williamsburg Dr
- 18610 Marsha St
- 18630 Marsha St
- 18600 Marsha St
- 18640 Marsha St
- 18623 Valade St
- 18633 Valade St
- 18611 Valade St
- 18645 Valade St
- 18590 Marsha St
- 18601 Valade St
- 18650 Marsha St
- 18657 Valade St
- 18625 Marsha St
- 18615 Marsha St
- 18591 Valade St
- 18605 Marsha St
- 18635 Marsha St
- 18595 Marsha St
- 18581 Valade St
- 18665 Marsha St
Your Personal Tour Guide
Ask me questions while you tour the home.