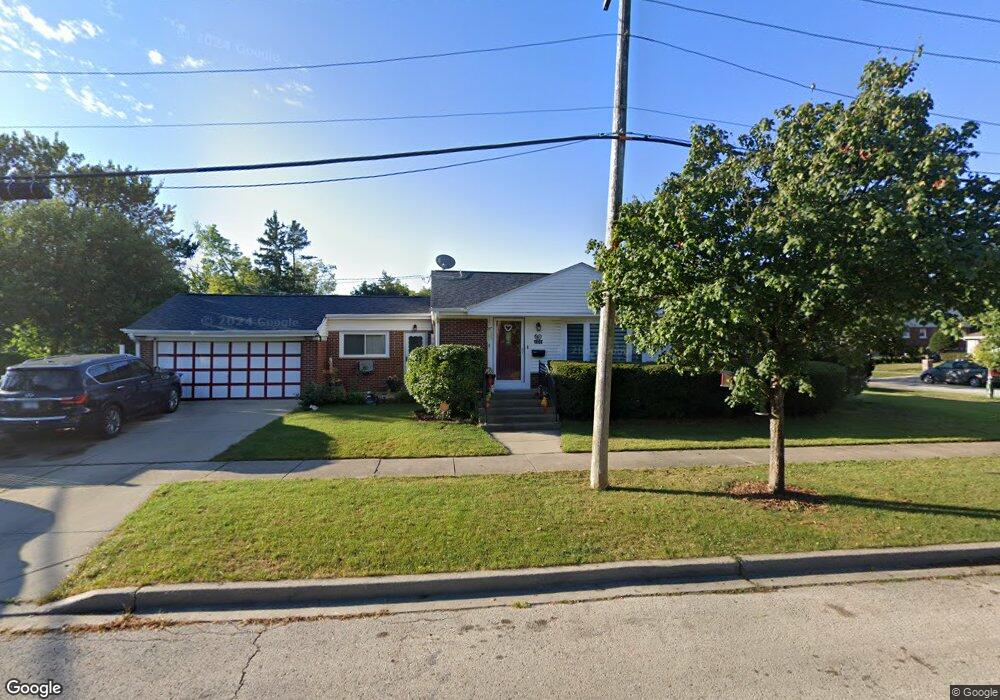
1865 Riverview Ave Des Plaines, IL 60018
Estimated Value: $333,000 - $378,404
About This Home
This home is located at 1865 Riverview Ave, Des Plaines, IL 60018 and is currently estimated at $357,101, approximately $335 per square foot. 1865 Riverview Ave is a home located in Cook County with nearby schools including South Elementary School, Algonquin Middle School, and Maine West High School.
Ownership History
We collect this data history from publicly available records. To have your information removed, we recommend requesting removal directly through your county’s website.
Purchase Details
Home Financials for this Owner
Home Financials are based on the most recent Mortgage that was taken out on this home.Purchase Details
Purchase Details
Purchase Details
Purchase Details
Home Values in the Area
Average Home Value in this Area
Purchase History
We collect this data history from publicly available records. To have your information removed, we recommend requesting removal directly through your county’s website.
| Date | Buyer | Sale Price | Title Company |
|---|---|---|---|
| $160,000 | None Available | ||
| -- | None Available | ||
| -- | -- | ||
| -- | -- | ||
| -- | -- |
Mortgage History
We collect this data history from publicly available records. To have your information removed, we recommend requesting removal directly through your county’s website.
| Date | Status | Borrower | Loan Amount |
|---|---|---|---|
| Open | $157,102 |
Tax History
We collect this data history from publicly available records. To have your information removed, we recommend requesting removal directly through your county’s website.
| Year | Tax Paid | Tax Assessment Tax Assessment Total Assessment is a certain percentage of the fair market value that is determined by local assessors to be the total taxable value of land and additions on the property. | Land | Improvement |
|---|---|---|---|---|
| 2025 | $5,717 | $30,000 | $6,059 | $23,941 |
| 2024 | $5,717 | $25,000 | $5,049 | $19,951 |
| 2023 | $5,553 | $25,000 | $5,049 | $19,951 |
| 2022 | $5,553 | $25,000 | $5,049 | $19,951 |
| 2021 | $4,283 | $17,264 | $4,207 | $13,057 |
| 2020 | $4,280 | $17,264 | $4,207 | $13,057 |
| 2019 | $4,297 | $19,398 | $4,207 | $15,191 |
| 2018 | $5,109 | $20,518 | $3,702 | $16,816 |
| 2017 | $5,036 | $20,518 | $3,702 | $16,816 |
| 2016 | $5,008 | $20,518 | $3,702 | $16,816 |
| 2015 | $4,090 | $16,152 | $3,197 | $12,955 |
| 2014 | $4,020 | $16,152 | $3,197 | $12,955 |
| 2013 | $3,902 | $16,152 | $3,197 | $12,955 |
Map
- 1640 S River Rd
- 1693 Linden St
- 1515 Orchard St
- 1653 Stockton Ave
- 1990 Berry Ln
- 1634 E Forest Ave
- 1280 S River Rd
- 1738 Whitcomb Ave
- 1857 Pine St
- 1220 S River Rd
- 2067 Sherwin Ave
- 1678 Ash St
- 1495 E Algonquin Rd
- 1548 Campbell Ave
- 2129 Ash St Unit G
- 1370 Fargo Ave Unit E
- 1455 Campbell Ave
- 1641 E Touhy Ave
- 38 E Touhy Ave
- 1629 E Touhy Ave
- 1735 Locust St
- 1743 Locust St
- 1725 Locust St
- 1715 Locust St
- 1757 Locust St
- 1738 Birch St
- 1730 Birch St
- 1756 Birch St
- 1722 Birch St
- 1761 Locust St
- 1714 Birch St
- 1740 Locust St
- 1730 Locust St
- 1716 Locust St
- 1750 Locust St
- 1885 Riverview Ave
- 1885 Riverview Ave
- 1758 Locust St
- 1769 Locust St
- 1708 Locust St
Ask me questions while you tour the home.