187 Cherry St Malden, MA 02148
Forestdale NeighborhoodEstimated Value: $751,000 - $843,000
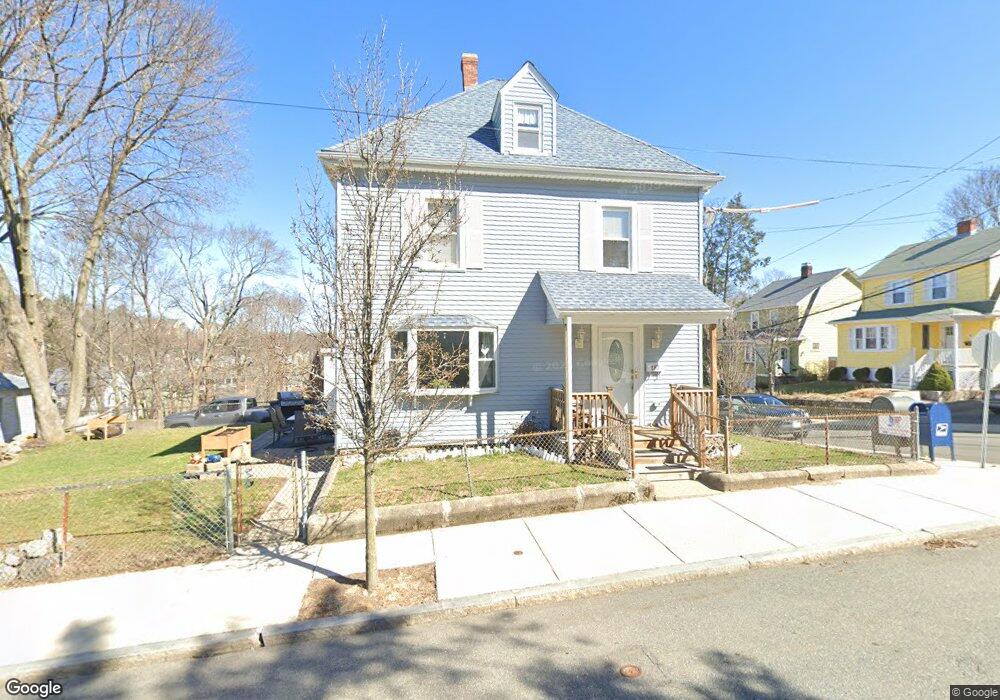
About This Home
This home is located at 187 Cherry St, Malden, MA 02148 and is currently estimated at $798,393, approximately $490 per square foot. 187 Cherry St is a home located in Middlesex County with nearby schools including Malden High School, St Mary's School, and Malden Catholic.
Ownership History
We collect this data history from publicly available records. To have your information removed, we recommend requesting removal directly through your county’s website.
Purchase Details
Purchase Details
Home Values in the Area
Average Home Value in this Area
Purchase History
We collect this data history from publicly available records. To have your information removed, we recommend requesting removal directly through your county’s website.
| Date | Buyer | Sale Price | Title Company |
|---|---|---|---|
| -- | None Available | ||
| -- | None Available | ||
| $112,000 | -- |
Mortgage History
We collect this data history from publicly available records. To have your information removed, we recommend requesting removal directly through your county’s website.
| Date | Status | Borrower | Loan Amount |
|---|---|---|---|
| Previous Owner | $208,250 | ||
| Previous Owner | $164,250 |
Tax History
We collect this data history from publicly available records. To have your information removed, we recommend requesting removal directly through your county’s website.
| Year | Tax Paid | Tax Assessment Tax Assessment Total Assessment is a certain percentage of the fair market value that is determined by local assessors to be the total taxable value of land and additions on the property. | Land | Improvement |
|---|---|---|---|---|
| 2025 | $7,399 | $653,600 | $321,800 | $331,800 |
| 2024 | $6,922 | $592,100 | $299,100 | $293,000 |
| 2023 | $6,814 | $559,000 | $272,300 | $286,700 |
| 2022 | $6,549 | $530,300 | $251,600 | $278,700 |
| 2021 | $6,231 | $507,000 | $236,400 | $270,600 |
| 2020 | $6,045 | $477,900 | $225,200 | $252,700 |
| 2019 | $5,788 | $436,200 | $214,500 | $221,700 |
| 2018 | $5,784 | $410,500 | $198,000 | $212,500 |
| 2017 | $5,555 | $392,000 | $189,800 | $202,200 |
| 2016 | $5,286 | $348,700 | $167,100 | $181,600 |
| 2015 | $5,164 | $328,300 | $158,800 | $169,500 |
| 2014 | $4,954 | $307,700 | $144,400 | $163,300 |
Map
- 30-32 Goldcliff Rd
- 50-52 Bainbridge St
- 197 Bainbridge St
- 5 S Mountain Ave
- 19 Lebanon St
- 28 N Mountain Ave
- 3 Bayrd Terrace
- 35 Mount Washington Ave
- 2 Swains Pond Ave
- 146 Pierce St
- 20 Hemenway Ct
- 241 Lebanon St
- 12 Mount Washington Ave
- 71 Williams St
- 31 Temple St
- 70 Crescent Ln
- 5 Hemenway Ave
- 468 Salem St
- 31 Wallace Cir Unit 31
- 548 Salem St
- 33 Kimball St Unit 35
- 197 Cherry St
- 49 Kimball St
- 29 Kimball St
- 181 Cherry St
- 36 Kimball St
- 196 Cherry St
- 53 Kimball St
- 34 Kimball St
- 36 Echo St
- 36 Echo St Unit 2
- 54 Kimball St
- 30 Echo St
- 25 Kimball St
- 59 Kimball St
- 202 Cherry St Unit 1
- 202 Cherry St
- 202 Cherry St Unit 2
- 24 Echo St
- 58 Echo St Unit 2
Ask me questions while you tour the home.