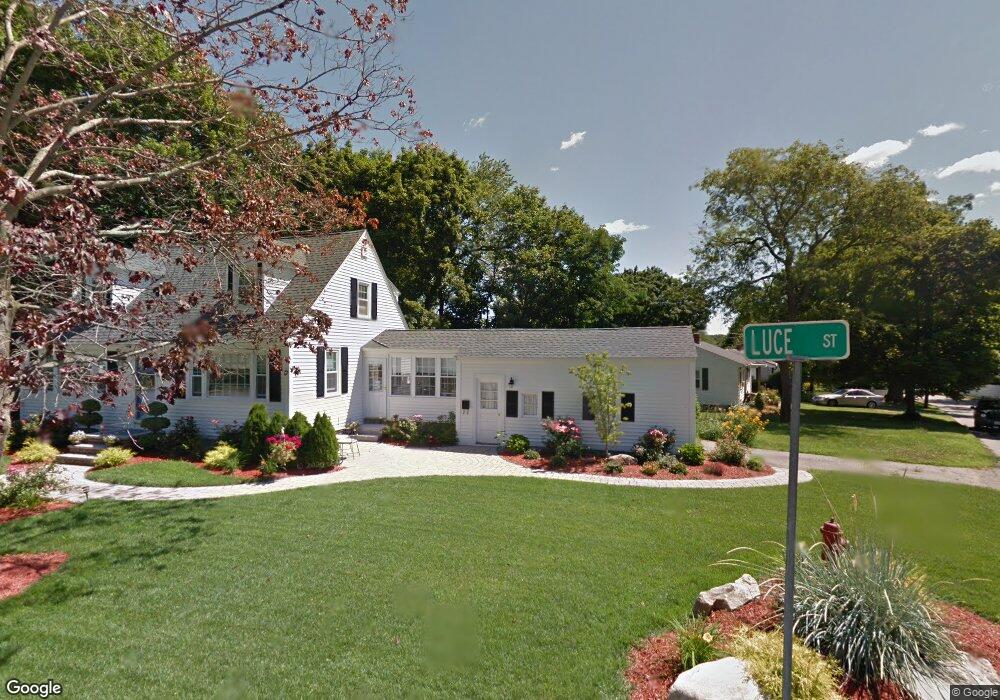
188 Luce St Lowell, MA 01852
Belvidere NeighborhoodEstimated Value: $574,000 - $655,000
3
Beds
2
Baths
1,670
Sq Ft
$371/Sq Ft
Est. Value
About This Home
This home is located at 188 Luce St, Lowell, MA 01852 and is currently estimated at $619,656, approximately $371 per square foot. 188 Luce St is a home located in Middlesex County with nearby schools including Moody Elementary School, Abraham Lincoln Elementary School, and Greenhalge Elementary School.
Ownership History
Date
Name
Owned For
Owner Type
Purchase Details
Closed on
Jul 31, 1997
Sold by
Est Hammerlsey Elinor and Lamb Kathleen R
Bought by
Greenwood David J and Greenwood Maria F
Current Estimated Value
Home Financials for this Owner
Home Financials are based on the most recent Mortgage that was taken out on this home.
Original Mortgage
$104,465
Interest Rate
7.55%
Mortgage Type
Purchase Money Mortgage
Create a Home Valuation Report for This Property
The Home Valuation Report is an in-depth analysis detailing your home's value as well as a comparison with similar homes in the area
Home Values in the Area
Average Home Value in this Area
Purchase History
We collect this data history from publicly available records. To have your information removed, we recommend requesting removal directly through your county’s website.
| Date | Buyer | Sale Price | Title Company |
|---|---|---|---|
| Greenwood David J | $122,900 | -- | |
| Greenwood David J | $122,900 | -- |
Source: Public Records
Mortgage History
We collect this data history from publicly available records. To have your information removed, we recommend requesting removal directly through your county’s website.
| Date | Status | Borrower | Loan Amount |
|---|---|---|---|
| Open | Greenwood David J | $116,000 | |
| Closed | Greenwood David J | $104,465 |
Source: Public Records
Tax History
| Year | Tax Paid | Tax Assessment Tax Assessment Total Assessment is a certain percentage of the fair market value that is determined by local assessors to be the total taxable value of land and additions on the property. | Land | Improvement |
|---|---|---|---|---|
| 2025 | $6,468 | $563,400 | $243,500 | $319,900 |
| 2024 | $6,159 | $517,100 | $227,500 | $289,600 |
| 2023 | $5,983 | $481,700 | $197,800 | $283,900 |
| 2022 | $5,485 | $432,200 | $179,900 | $252,300 |
| 2021 | $5,151 | $382,700 | $156,400 | $226,300 |
| 2020 | $5,074 | $379,800 | $156,400 | $223,400 |
| 2019 | $5,033 | $358,500 | $155,600 | $202,900 |
| 2018 | $4,862 | $337,900 | $148,200 | $189,700 |
| 2017 | $4,704 | $315,300 | $137,500 | $177,800 |
| 2016 | $4,339 | $286,200 | $126,500 | $159,700 |
| 2015 | $4,307 | $278,200 | $126,500 | $151,700 |
| 2013 | $4,074 | $271,400 | $139,600 | $131,800 |
Source: Public Records
Map
Nearby Homes
- 54 Wentworth Ave
- 21 Guild St
- 18 Nob Way
- 105 Starr Ave
- 588 Andover St
- 36 Glenn Rd
- 25 Windward Rd
- 471 Butman Rd
- 317 Nesmith St
- 273 Rogers St
- 87 Dancause Rd
- 105 Stafford Rd
- 333 First Street Blvd Unit 209
- 62 Huntington St
- 116 Fort Hill Ave
- 35 Burnham Rd
- 52 Christian St
- 58 Brunswick St
- 112 Durant St
- 100 Rogers St Unit 1
Your Personal Tour Guide
Ask me questions while you tour the home.