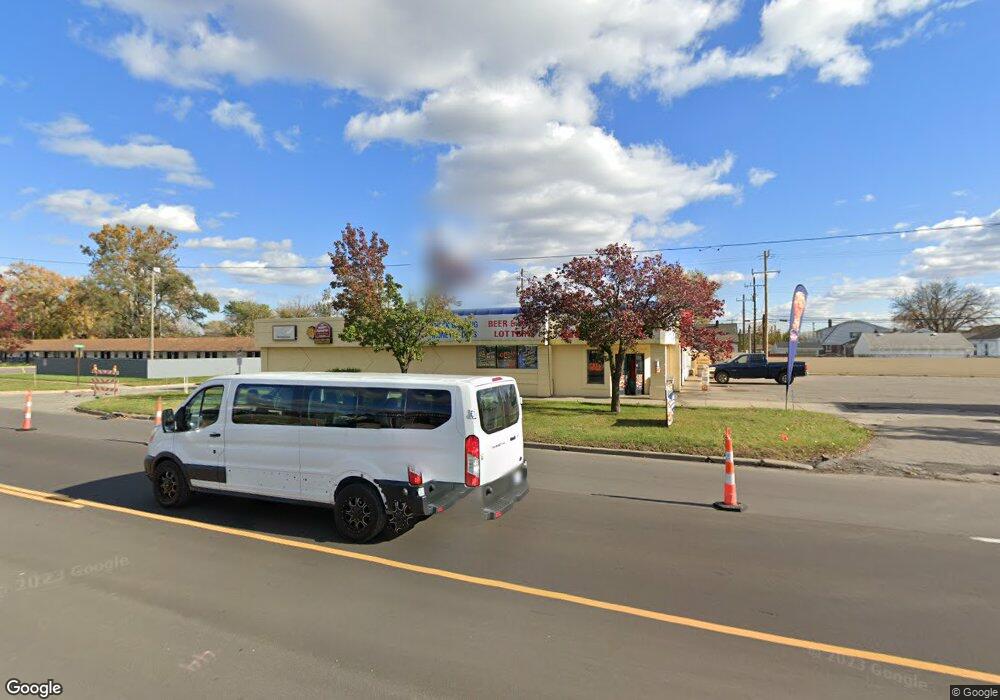
18800 Dix Rd Melvindale, MI 48122
Estimated Value: $802,092
Studio
--
Bath
6,591
Sq Ft
$122/Sq Ft
Est. Value
About This Home
This home is located at 18800 Dix Rd, Melvindale, MI 48122 and is currently estimated at $802,092, approximately $121 per square foot. 18800 Dix Rd is a home located in Wayne County with nearby schools including Rogers Early Elementary School, Allendale Elementary School, and Julian O. Strong Middle School.
Ownership History
Date
Name
Owned For
Owner Type
Purchase Details
Closed on
Nov 5, 2013
Sold by
S & C Ventures Llc
Bought by
S & M Property Group Llc
Current Estimated Value
Purchase Details
Closed on
Apr 7, 2003
Sold by
Z & A Properties Llc
Bought by
Frank & Mary Llc
Purchase Details
Closed on
Dec 7, 2001
Sold by
Saroki & Sitto Building
Bought by
Z & A Properties Llc
Purchase Details
Closed on
May 13, 1998
Sold by
Farid Farida Bernice and Farid Farida
Bought by
Saroki & Sitto Building
Create a Home Valuation Report for This Property
The Home Valuation Report is an in-depth analysis detailing your home's value as well as a comparison with similar homes in the area
Home Values in the Area
Average Home Value in this Area
Purchase History
We collect this data history from publicly available records. To have your information removed, we recommend requesting removal directly through your county’s website.
| Date | Buyer | Sale Price | Title Company |
|---|---|---|---|
| S & M Property Group Llc | $400,000 | None Available | |
| Frank & Mary Llc | $350,000 | Metropolitan Title | |
| Z & A Properties Llc | $350,000 | -- | |
| Saroki & Sitto Building | $280,000 | -- |
Source: Public Records
Tax History
| Year | Tax Paid | Tax Assessment Tax Assessment Total Assessment is a certain percentage of the fair market value that is determined by local assessors to be the total taxable value of land and additions on the property. | Land | Improvement |
|---|---|---|---|---|
| 2025 | $8,331 | $157,100 | $0 | $0 |
| 2024 | $8,085 | $160,200 | $0 | $0 |
| 2023 | $7,689 | $153,000 | $0 | $0 |
| 2022 | $12,358 | $137,300 | $0 | $0 |
| 2021 | $12,098 | $134,300 | $0 | $0 |
| 2020 | $12,038 | $134,400 | $0 | $0 |
| 2019 | $11,288 | $149,000 | $0 | $0 |
| 2018 | $7,639 | $127,200 | $0 | $0 |
| 2017 | $6,632 | $124,400 | $0 | $0 |
| 2016 | $10,810 | $124,400 | $0 | $0 |
| 2015 | $12,670 | $126,700 | $0 | $0 |
| 2013 | $12,320 | $123,200 | $0 | $0 |
| 2012 | $7,373 | $123,200 | $39,400 | $83,800 |
Source: Public Records
Map
Nearby Homes
Your Personal Tour Guide
Ask me questions while you tour the home.