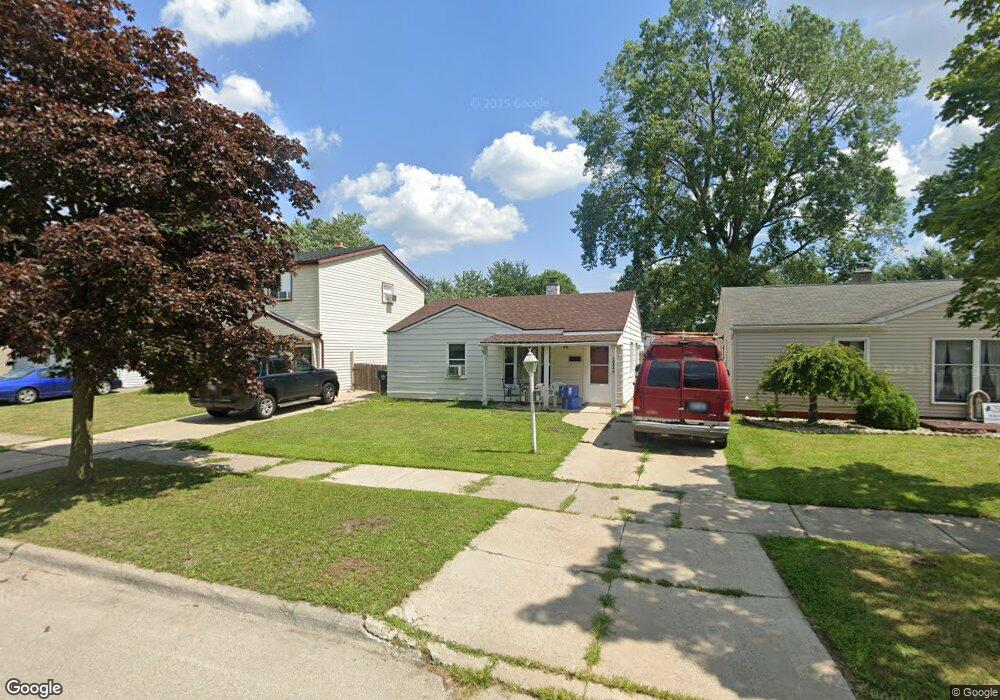
18840 Wall St Melvindale, MI 48122
Estimated Value: $106,389 - $143,000
2
Beds
1
Bath
819
Sq Ft
$145/Sq Ft
Est. Value
About This Home
This home is located at 18840 Wall St, Melvindale, MI 48122 and is currently estimated at $118,597, approximately $144 per square foot. 18840 Wall St is a home located in Wayne County with nearby schools including Rogers Early Elementary School, Allendale Elementary School, and Julian O. Strong Middle School.
Ownership History
Date
Name
Owned For
Owner Type
Purchase Details
Closed on
Feb 23, 2023
Sold by
Lengyel Michael A
Bought by
Struble Shirley A
Current Estimated Value
Purchase Details
Closed on
Nov 7, 2013
Sold by
Deutsche Bank National Trust Company
Bought by
Lengyel Michael A
Home Financials for this Owner
Home Financials are based on the most recent Mortgage that was taken out on this home.
Original Mortgage
$48,100
Interest Rate
4.31%
Mortgage Type
New Conventional
Purchase Details
Closed on
Jan 31, 1996
Sold by
Va
Bought by
Fleet Mtg Corp
Create a Home Valuation Report for This Property
The Home Valuation Report is an in-depth analysis detailing your home's value as well as a comparison with similar homes in the area
Home Values in the Area
Average Home Value in this Area
Purchase History
We collect this data history from publicly available records. To have your information removed, we recommend requesting removal directly through your county’s website.
| Date | Buyer | Sale Price | Title Company |
|---|---|---|---|
| Struble Shirley A | $48,500 | -- | |
| Lengyel Michael A | $42,126 | Title Source Inc | |
| Fleet Mtg Corp | -- | -- |
Source: Public Records
Mortgage History
We collect this data history from publicly available records. To have your information removed, we recommend requesting removal directly through your county’s website.
| Date | Status | Borrower | Loan Amount |
|---|---|---|---|
| Previous Owner | Lengyel Michael A | $48,100 |
Source: Public Records
Tax History
| Year | Tax Paid | Tax Assessment Tax Assessment Total Assessment is a certain percentage of the fair market value that is determined by local assessors to be the total taxable value of land and additions on the property. | Land | Improvement |
|---|---|---|---|---|
| 2025 | $3,093 | $64,500 | $0 | $0 |
| 2024 | $3,002 | $56,200 | $0 | $0 |
| 2023 | $1,188 | $43,400 | $0 | $0 |
| 2022 | $1,910 | $39,100 | $0 | $0 |
| 2021 | $1,851 | $34,800 | $0 | $0 |
| 2020 | $1,840 | $26,900 | $0 | $0 |
| 2019 | $1,726 | $22,800 | $0 | $0 |
| 2018 | $1,168 | $21,900 | $0 | $0 |
| 2017 | $1,014 | $21,700 | $0 | $0 |
| 2016 | $1,638 | $20,500 | $0 | $0 |
| 2015 | $1,880 | $18,800 | $0 | $0 |
| 2013 | $1,830 | $19,200 | $0 | $0 |
| 2012 | $1,235 | $18,700 | $3,000 | $15,700 |
Source: Public Records
Map
Nearby Homes
- 18800 Wall St
- 18948 Wall St
- 2735 Margaret St
- 18906 Dix Rd
- 19120 Dix Rd
- 000 Harlow St
- 2140 Olive Ave
- 2388 Corbin St
- 2346 Bloomfield St
- 18616 Ruth St
- 24558 Outer Dr
- 2112 Reo Ave
- 18051 Reed St
- 2040 Reo Ave
- 0002 Prospect St
- 18634 Wood St
- 0000 Prospect St
- 001 Prospect St
- 000 Prospect St
- 17951 Prospect St
Your Personal Tour Guide
Ask me questions while you tour the home.