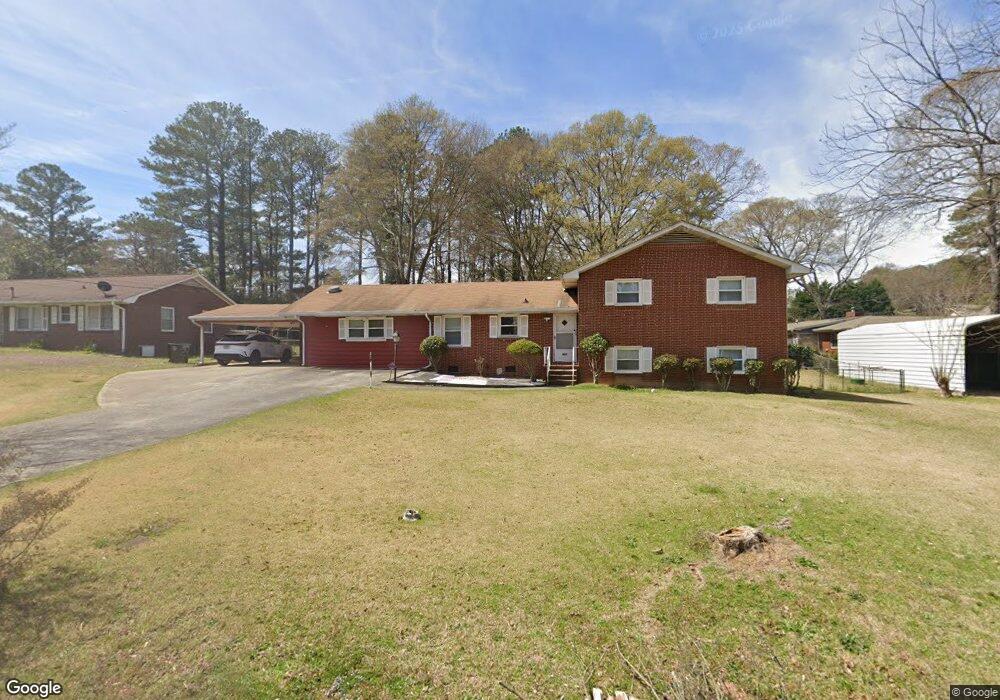
1885 Argonne Dr Morrow, GA 30260
Estimated Value: $218,706 - $275,000
4
Beds
2
Baths
1,644
Sq Ft
$145/Sq Ft
Est. Value
About This Home
This home is located at 1885 Argonne Dr, Morrow, GA 30260 and is currently estimated at $238,677, approximately $145 per square foot. 1885 Argonne Dr is a home located in Clayton County with nearby schools including Morrow Elementary School, Morrow Middle School, and Morrow High School.
Ownership History
Date
Name
Owned For
Owner Type
Purchase Details
Closed on
Jun 10, 2024
Sold by
Nguyen Hong Anh Thi
Bought by
Nguyen Hoa T
Current Estimated Value
Purchase Details
Closed on
Jan 5, 2024
Sold by
Nguyen Hoa T
Bought by
Nguyen Hong Anh Thi
Purchase Details
Closed on
Mar 10, 2018
Sold by
Nguyen V Duong V
Bought by
Nguyen Hoa T and Nguyen Hong Cat Thi
Purchase Details
Closed on
Jul 30, 2010
Sold by
Jp Morgan Mtg Trust 2006-Cw1
Bought by
Nguyen Duong and Nguyen Hoa T
Purchase Details
Closed on
Apr 6, 2010
Sold by
Khamvongsa Khamkane and Khamvongsa Saysavanh
Bought by
Jp Morgan Mtg Acqu Trust 2006-
Purchase Details
Closed on
Jan 3, 2006
Sold by
Miller Paul E
Bought by
Khamvongsa Khamkane
Home Financials for this Owner
Home Financials are based on the most recent Mortgage that was taken out on this home.
Original Mortgage
$122,800
Interest Rate
8.35%
Mortgage Type
New Conventional
Create a Home Valuation Report for This Property
The Home Valuation Report is an in-depth analysis detailing your home's value as well as a comparison with similar homes in the area
Home Values in the Area
Average Home Value in this Area
Purchase History
| Date | Buyer | Sale Price | Title Company |
|---|---|---|---|
| Nguyen Hoa T | -- | -- | |
| Nguyen Hong Anh Thi | -- | -- | |
| Nguyen Hoa T | $93,000 | -- | |
| Nguyen Duong | $61,000 | -- | |
| Jp Morgan Mtg Acqu Trust 2006- | $65,655 | -- | |
| Khamvongsa Khamkane | $153,500 | -- |
Source: Public Records
Mortgage History
| Date | Status | Borrower | Loan Amount |
|---|---|---|---|
| Previous Owner | Khamvongsa Khamkane | $122,800 |
Source: Public Records
Tax History
| Year | Tax Paid | Tax Assessment Tax Assessment Total Assessment is a certain percentage of the fair market value that is determined by local assessors to be the total taxable value of land and additions on the property. | Land | Improvement |
|---|---|---|---|---|
| 2025 | $1,107 | $84,000 | $7,200 | $76,800 |
| 2024 | $1,121 | $89,040 | $7,200 | $81,840 |
| 2023 | $3,305 | $83,720 | $7,200 | $76,520 |
| 2022 | $757 | $61,400 | $7,200 | $54,200 |
| 2021 | $1,216 | $45,000 | $7,200 | $37,800 |
| 2020 | $957 | $37,284 | $7,200 | $30,084 |
| 2019 | $1,092 | $40,666 | $6,400 | $34,266 |
| 2018 | $1,165 | $42,739 | $6,400 | $36,339 |
| 2017 | $982 | $37,512 | $6,400 | $31,112 |
| 2016 | $794 | $32,256 | $6,400 | $25,856 |
| 2015 | $795 | $0 | $0 | $0 |
| 2014 | $647 | $28,585 | $6,400 | $22,185 |
Source: Public Records
Map
Nearby Homes
- 6541 Debbie Sue Ln
- 6532 Debbie Sue Ln
- 6577 Randall Mark Dr
- 1804 Carla Dr
- 1893 Stratford Arms Dr
- 6395 Heritage Run
- 6663 Peacock Blvd
- 2275 Santa fe St Unit 25
- 2117 Amish Ct
- 1924 Mural Cir
- 6495 Revena Dr
- 6430 Oakleaf Way
- 6186 Deans Way
- 6566 Melandre Dr
- 1910 Old Rex Morrow Rd
- 1865 Oxford Dr
- 6852 Wendy Jean Dr
- 2104 Murry Trail
- 6424 Woodstone Way
- 6425 Woodstone Way
- 1889 Argonne Dr
- 1845 Argonne Dr
- 1881 Argonne Dr
- 1837 Argonne Dr
- 1848 Pershing Way
- 1886 Argonne Dr Unit 1
- 1860 Pershing Way
- 1882 Argonne Dr
- 1890 Argonne Dr
- 1838 Pershing Way
- 1878 Argonne Dr
- 6480 Meadowbrook Ln Unit 1
- 1894 Argonne Dr
- 6492 Meadowbrook Ln
- 1846 Argonne Dr
- 1858 Argonne Dr
- 6462 Meadowbrook Ln Unit I
- 1870 Argonne Dr
- 6504 Meadowbrook Ln
- 1898 Argonne Dr
Your Personal Tour Guide
Ask me questions while you tour the home.