1899 W 1130 S Payson, UT 84651
Estimated Value: $785,000 - $1,501,000
4
Beds
4
Baths
3,827
Sq Ft
$304/Sq Ft
Est. Value
About This Home
This home is located at 1899 W 1130 S, Payson, UT 84651 and is currently estimated at $1,164,385, approximately $304 per square foot. 1899 W 1130 S is a home located in Utah County with nearby schools including Taylor Elementary School, Salem Junior High School, and Valley View Middle School.
Ownership History
Date
Name
Owned For
Owner Type
Purchase Details
Closed on
May 21, 2021
Sold by
Huff Erik
Bought by
Huff Erik and Fox Tanya
Current Estimated Value
Home Financials for this Owner
Home Financials are based on the most recent Mortgage that was taken out on this home.
Original Mortgage
$405,000
Outstanding Balance
$366,457
Interest Rate
3%
Mortgage Type
New Conventional
Estimated Equity
$797,928
Purchase Details
Closed on
Feb 20, 2019
Sold by
Simonson Paul Dennis and Simonson Ava Jane
Bought by
Huff Erik and Fox Ronald
Home Financials for this Owner
Home Financials are based on the most recent Mortgage that was taken out on this home.
Original Mortgage
$260,000
Interest Rate
4.4%
Mortgage Type
New Conventional
Purchase Details
Closed on
Nov 14, 2016
Sold by
Simonson Paul D and Simonson Ava
Bought by
Simonson Paul Dennis and Simonson Ava Jane
Purchase Details
Closed on
Oct 11, 2016
Sold by
Simonson Paul and Simonson Ava
Bought by
Simonson Paul Dennis and Simonson Ava Jane
Purchase Details
Closed on
Jun 19, 2002
Sold by
Far West Bank
Bought by
Simonson Paul and Simonson Ava
Create a Home Valuation Report for This Property
The Home Valuation Report is an in-depth analysis detailing your home's value as well as a comparison with similar homes in the area
Home Values in the Area
Average Home Value in this Area
Purchase History
We collect this data history from publicly available records. To have your information removed, we recommend requesting removal directly through your county’s website.
| Date | Buyer | Sale Price | Title Company |
|---|---|---|---|
| Huff Erik | -- | Trident Title Ins Agency | |
| Huff Erik | -- | Trident Title Ins Agency | |
| Huff Erik | -- | Provo Land Title Co | |
| Simonson Paul Dennis | -- | None Available | |
| Simonson Paul Dennis | -- | None Available | |
| Simonson Paul | -- | -- |
Source: Public Records
Mortgage History
We collect this data history from publicly available records. To have your information removed, we recommend requesting removal directly through your county’s website.
| Date | Status | Borrower | Loan Amount |
|---|---|---|---|
| Open | Huff Erik | $405,000 | |
| Closed | Huff Erik | $260,000 |
Source: Public Records
Tax History
| Year | Tax Paid | Tax Assessment Tax Assessment Total Assessment is a certain percentage of the fair market value that is determined by local assessors to be the total taxable value of land and additions on the property. | Land | Improvement |
|---|---|---|---|---|
| 2025 | $3,273 | $339,298 | -- | -- |
| 2024 | $3,273 | $333,092 | $0 | $0 |
| 2023 | $3,270 | $333,756 | $0 | $0 |
| 2022 | $2,711 | $737,900 | $390,700 | $347,200 |
| 2021 | $2,358 | $536,400 | $269,500 | $266,900 |
| 2020 | $2,080 | $498,600 | $231,700 | $266,900 |
| 2019 | $1,905 | $429,000 | $182,600 | $246,400 |
| 2018 | $1,832 | $386,500 | $162,600 | $223,900 |
| 2017 | $1,867 | $156,288 | $0 | $0 |
| 2016 | $1,716 | $142,658 | $0 | $0 |
| 2015 | $1,450 | $119,713 | $0 | $0 |
| 2014 | $1,602 | $119,823 | $0 | $0 |
Source: Public Records
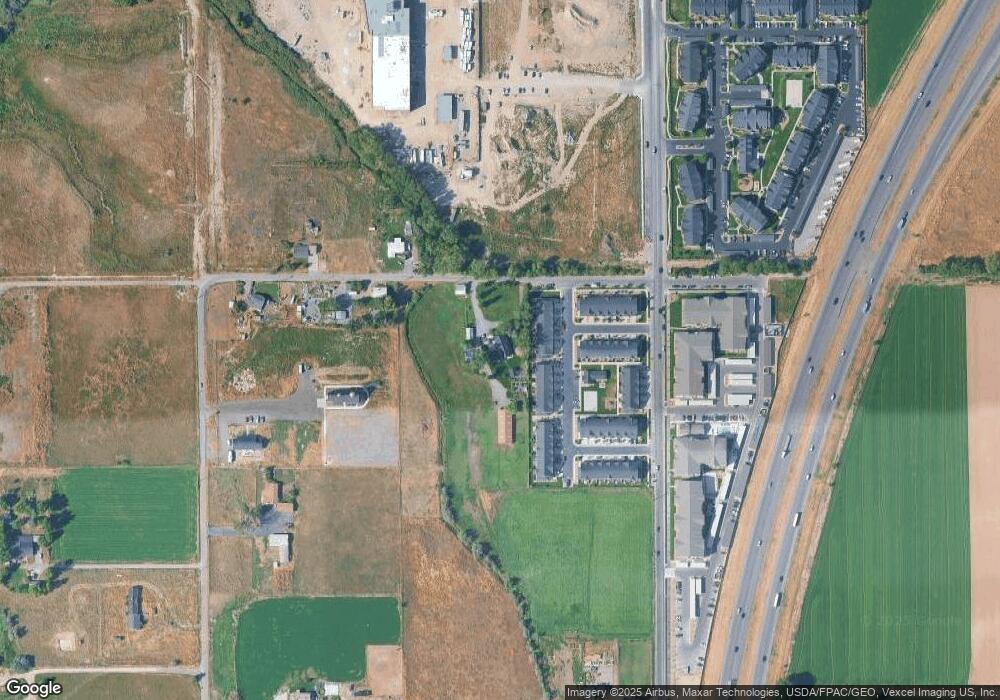
Map
Nearby Homes
- 1208 S 1740 W
- 2200 W 1130 St S
- 1964 W 1150 S Unit 1029
- 1967 W 1150 S Unit 1033
- 1967 W 1150 S
- 1968 W 1150 S Unit 1028
- 1971 W 1150 S
- 1971 W 1150 S Unit 1034
- 1972 W 1150 S Unit 1027
- 1973 W 1150 S Unit 1035
- 1973 W 1150 S
- 1979 W 1150 S
- 1979 W 1150 S Unit 1036
- 1983 W 1150 S
- 1983 W 1150 S Unit 1037
- 1984 W 1150 S Unit 1024
- 1988 W 1150 S Unit 1023
- 1992 W 1150 S Unit 1022
- 1045 S 1700 W Unit 1232
- 1045 S 1700 W Unit 232
- 1176 S 1740 W
- 1168 S 1740 W
- 1164 S 1740 W Unit 19
- 1178 S 1740 W
- 1158 S 1740 W Unit 18
- 1182 S 1740 W
- 1152 S 1740 W Unit 17
- 1186 S 1740 W
- 1186 S 1740 W Unit 24
- 1142 1740 W
- 1192 S 1740 W Unit 25
- 1138 S 1740 W
- 1194 S 1740 W
- 4675 W 11200 S
- 1198 S 1740 W
- 1198 S 1740 W Unit 27
- 4731 W 11200 S
- 1735 W 1160 S
- 1735 W 1160 S Unit 14
- 1204 S 1740 W Unit 28
Your Personal Tour Guide
Ask me questions while you tour the home.