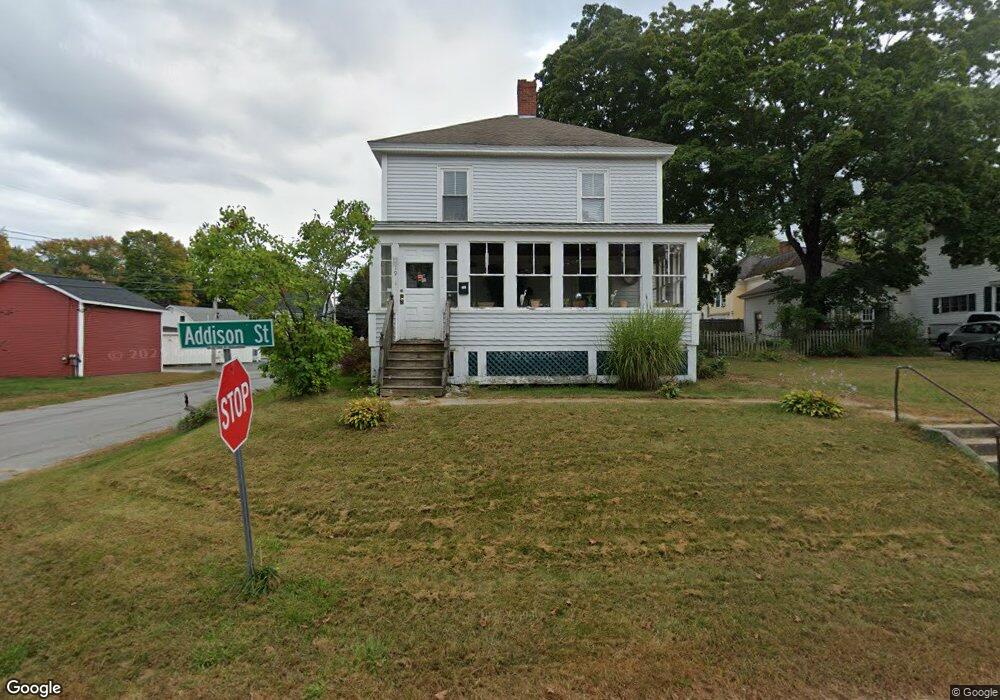
19 Addison St Lisbon Falls, ME 04252
Estimated Value: $258,668 - $332,000
3
Beds
1
Bath
1,700
Sq Ft
$175/Sq Ft
Est. Value
About This Home
This home is located at 19 Addison St, Lisbon Falls, ME 04252 and is currently estimated at $297,667, approximately $175 per square foot. 19 Addison St is a home located in Androscoggin County with nearby schools including Lisbon Community School, Philip W. Sugg Middle School, and Lisbon High School.
Ownership History
Date
Name
Owned For
Owner Type
Purchase Details
Closed on
Nov 12, 2008
Sold by
Citibank Na Tr
Bought by
Turcotte James M and Paul Jhawn D
Current Estimated Value
Home Financials for this Owner
Home Financials are based on the most recent Mortgage that was taken out on this home.
Original Mortgage
$123,800
Outstanding Balance
$79,421
Interest Rate
6.13%
Mortgage Type
Commercial
Estimated Equity
$218,246
Purchase Details
Closed on
Dec 19, 2005
Sold by
Brown 3Rd James C
Bought by
Pineau Mark L and Ursell Nancy A
Home Financials for this Owner
Home Financials are based on the most recent Mortgage that was taken out on this home.
Original Mortgage
$112,800
Interest Rate
6.34%
Mortgage Type
Commercial
Create a Home Valuation Report for This Property
The Home Valuation Report is an in-depth analysis detailing your home's value as well as a comparison with similar homes in the area
Home Values in the Area
Average Home Value in this Area
Purchase History
We collect this data history from publicly available records. To have your information removed, we recommend requesting removal directly through your county’s website.
| Date | Buyer | Sale Price | Title Company |
|---|---|---|---|
| Turcotte James M | -- | -- | |
| Citibank Na Tr | -- | -- | |
| Pineau Mark L | -- | -- |
Source: Public Records
Mortgage History
We collect this data history from publicly available records. To have your information removed, we recommend requesting removal directly through your county’s website.
| Date | Status | Borrower | Loan Amount |
|---|---|---|---|
| Open | Citibank Na Tr | $123,800 | |
| Previous Owner | Pineau Mark L | $112,800 | |
| Previous Owner | Pineau Mark L | $28,200 |
Source: Public Records
Tax History
| Year | Tax Paid | Tax Assessment Tax Assessment Total Assessment is a certain percentage of the fair market value that is determined by local assessors to be the total taxable value of land and additions on the property. | Land | Improvement |
|---|---|---|---|---|
| 2025 | $3,324 | $192,700 | $41,200 | $151,500 |
| 2024 | $2,621 | $192,700 | $41,200 | $151,500 |
| 2023 | $2,260 | $107,100 | $27,200 | $79,900 |
| 2022 | $2,474 | $107,100 | $27,200 | $79,900 |
| 2021 | $2,367 | $107,100 | $27,200 | $79,900 |
| 2020 | $2,474 | $107,100 | $27,200 | $79,900 |
| 2019 | $2,474 | $107,100 | $27,200 | $79,900 |
| 2018 | $2,300 | $92,600 | $23,700 | $68,900 |
| 2017 | $2,148 | $92,600 | $23,700 | $68,900 |
| 2016 | $2,074 | $92,600 | $23,700 | $68,900 |
| 2015 | $2,201 | $102,000 | $23,600 | $78,400 |
| 2014 | $2,279 | $102,000 | $23,600 | $78,400 |
| 2013 | -- | $102,000 | $23,600 | $78,400 |
Source: Public Records
Map
Nearby Homes
- 0 Dolores St Unit 1220070
- 0 Dolores St Unit 1039200
- 0 Dolores St Unit 1080267
- 0 Dolores St Unit 1127122
- 0 Delores St Unit 1283057
- 15 Addison St
- 13 Addison St
- 16 Addison St
- 17 Addison St
- 14 Addison St
- 74 Main St
- 76 Main St
- 12 Addison St
- 70 Main St
- 78 Main St
- 11 Addison St
- 9 Addison St
- 77 Main St Unit Main St Duplex-- Uni
- 77 Main St Unit Main St Duplex
- 68 Main St
Your Personal Tour Guide
Ask me questions while you tour the home.