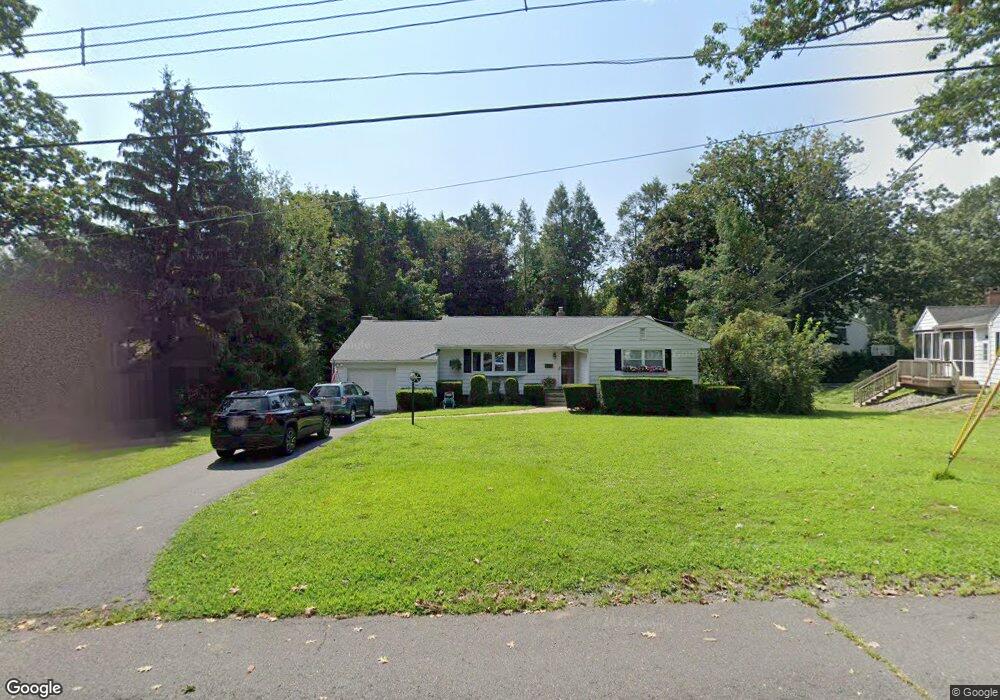
19 Brainerd Dr Cranbury, NJ 08512
Estimated Value: $692,000 - $797,935
Studio
--
Bath
1,580
Sq Ft
$480/Sq Ft
Est. Value
About This Home
This home is located at 19 Brainerd Dr, Cranbury, NJ 08512 and is currently estimated at $757,984, approximately $479 per square foot. 19 Brainerd Dr is a home located in Middlesex County with nearby schools including The Cranbury School, SciCore Academy, and E Windsor Knowledge Beginnings.
Ownership History
Date
Name
Owned For
Owner Type
Purchase Details
Closed on
Jan 28, 2009
Sold by
Dombrowski Cecilia A
Bought by
Dombrowski Kathleen
Current Estimated Value
Purchase Details
Closed on
Jan 25, 1996
Sold by
Mount Jr Nelson
Bought by
Dombrowski Cynthia
Home Financials for this Owner
Home Financials are based on the most recent Mortgage that was taken out on this home.
Original Mortgage
$169,000
Outstanding Balance
$5,661
Interest Rate
7.25%
Estimated Equity
$752,323
Create a Home Valuation Report for This Property
The Home Valuation Report is an in-depth analysis detailing your home's value as well as a comparison with similar homes in the area
Home Values in the Area
Average Home Value in this Area
Purchase History
We collect this data history from publicly available records. To have your information removed, we recommend requesting removal directly through your county’s website.
| Date | Buyer | Sale Price | Title Company |
|---|---|---|---|
| Dombrowski Kathleen | $250,000 | None Available | |
| Dombrowski Cynthia | $210,750 | -- |
Source: Public Records
Mortgage History
We collect this data history from publicly available records. To have your information removed, we recommend requesting removal directly through your county’s website.
| Date | Status | Borrower | Loan Amount |
|---|---|---|---|
| Open | Dombrowski Cynthia | $169,000 |
Source: Public Records
Tax History
| Year | Tax Paid | Tax Assessment Tax Assessment Total Assessment is a certain percentage of the fair market value that is determined by local assessors to be the total taxable value of land and additions on the property. | Land | Improvement |
|---|---|---|---|---|
| 2025 | $7,668 | $418,100 | $218,600 | $199,500 |
| 2024 | $7,559 | $418,100 | $218,600 | $199,500 |
| 2023 | $7,559 | $418,100 | $218,600 | $199,500 |
| 2022 | $7,451 | $418,100 | $218,600 | $199,500 |
| 2021 | $4,188 | $418,100 | $218,600 | $199,500 |
| 2020 | $7,442 | $418,100 | $218,600 | $199,500 |
| 2019 | $7,522 | $418,100 | $218,600 | $199,500 |
| 2018 | $8,232 | $418,100 | $218,600 | $199,500 |
| 2017 | $8,015 | $418,100 | $218,600 | $199,500 |
| 2016 | $8,082 | $418,100 | $218,600 | $199,500 |
| 2015 | $7,936 | $418,100 | $218,600 | $199,500 |
| 2014 | $7,965 | $418,100 | $218,600 | $199,500 |
Source: Public Records
Map
Nearby Homes
Your Personal Tour Guide
Ask me questions while you tour the home.