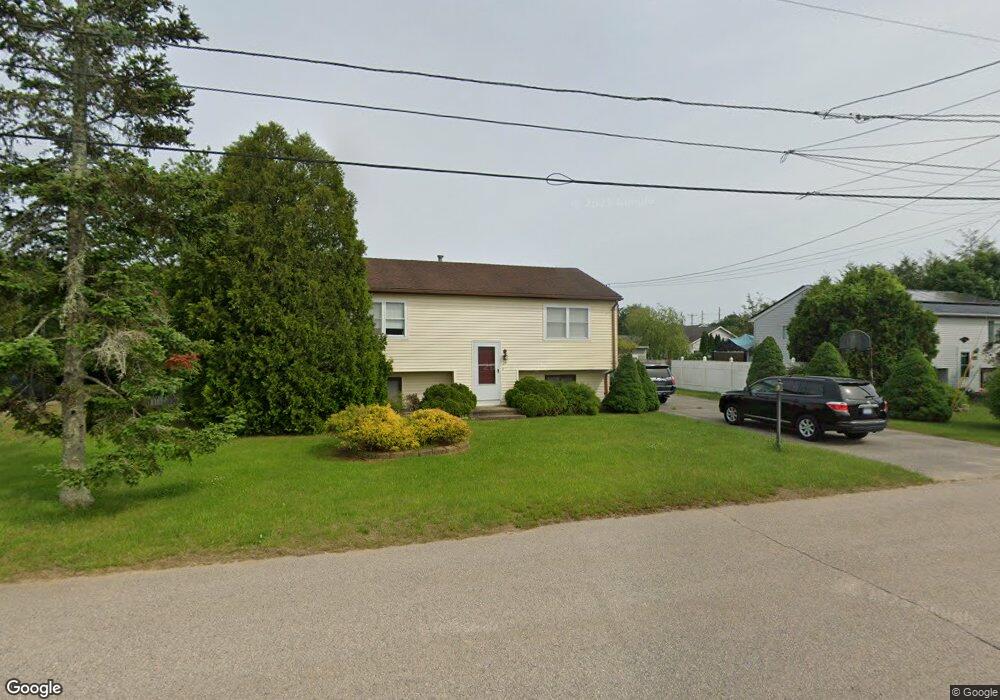
19 Byron Dr Westerly, RI 02891
Estimated Value: $410,194 - $454,000
2
Beds
2
Baths
864
Sq Ft
$506/Sq Ft
Est. Value
About This Home
This home is located at 19 Byron Dr, Westerly, RI 02891 and is currently estimated at $436,799, approximately $505 per square foot. 19 Byron Dr is a home located in Washington County with nearby schools including Westerly High School, North Stonington Christian Academy, and St. Michael School.
Ownership History
Date
Name
Owned For
Owner Type
Purchase Details
Closed on
Jan 18, 1995
Sold by
Oates Phillip and Oates Marian
Bought by
Stearns Alan L and Stearns Shannon
Current Estimated Value
Home Financials for this Owner
Home Financials are based on the most recent Mortgage that was taken out on this home.
Original Mortgage
$97,920
Interest Rate
9.16%
Create a Home Valuation Report for This Property
The Home Valuation Report is an in-depth analysis detailing your home's value as well as a comparison with similar homes in the area
Home Values in the Area
Average Home Value in this Area
Purchase History
We collect this data history from publicly available records. To have your information removed, we recommend requesting removal directly through your county’s website.
| Date | Buyer | Sale Price | Title Company |
|---|---|---|---|
| Stearns Alan L | $96,000 | -- |
Source: Public Records
Mortgage History
We collect this data history from publicly available records. To have your information removed, we recommend requesting removal directly through your county’s website.
| Date | Status | Borrower | Loan Amount |
|---|---|---|---|
| Open | Stearns Alan L | $86,000 | |
| Closed | Stearns Alan L | $95,780 | |
| Closed | Stearns Alan L | $97,920 | |
| Previous Owner | Stearns Alan L | $52,000 |
Source: Public Records
Tax History
| Year | Tax Paid | Tax Assessment Tax Assessment Total Assessment is a certain percentage of the fair market value that is determined by local assessors to be the total taxable value of land and additions on the property. | Land | Improvement |
|---|---|---|---|---|
| 2025 | $2,634 | $338,500 | $147,300 | $191,200 |
| 2024 | $2,795 | $267,500 | $105,200 | $162,300 |
| 2023 | $2,718 | $267,500 | $105,200 | $162,300 |
| 2022 | $2,702 | $267,500 | $105,200 | $162,300 |
| 2021 | $2,642 | $219,100 | $91,500 | $127,600 |
| 2020 | $2,596 | $219,100 | $91,500 | $127,600 |
| 2019 | $2,572 | $219,100 | $91,500 | $127,600 |
| 2018 | $2,461 | $199,300 | $91,500 | $107,800 |
| 2017 | $2,392 | $199,300 | $91,500 | $107,800 |
| 2016 | $2,392 | $199,300 | $91,500 | $107,800 |
| 2015 | $2,259 | $201,200 | $93,400 | $107,800 |
| 2014 | $2,223 | $201,200 | $93,400 | $107,800 |
Source: Public Records
Map
Nearby Homes
Your Personal Tour Guide
Ask me questions while you tour the home.