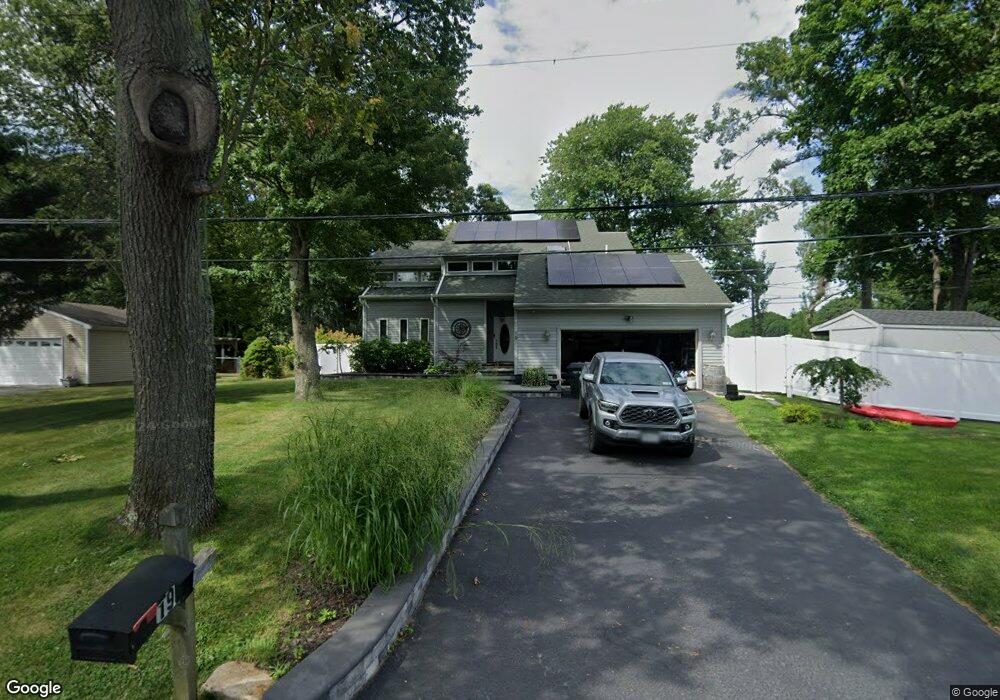
19 Cedar St East Patchogue, NY 11772
Estimated Value: $598,214 - $794,000
3
Beds
1
Bath
1,520
Sq Ft
$441/Sq Ft
Est. Value
About This Home
This home is located at 19 Cedar St, East Patchogue, NY 11772 and is currently estimated at $670,554, approximately $441 per square foot. 19 Cedar St is a home located in Suffolk County with nearby schools including Frank P Long Intermediate School, Bellport Middle School, and Bellport Senior High School.
Ownership History
Date
Name
Owned For
Owner Type
Purchase Details
Closed on
Jan 11, 2016
Sold by
Malguarnera Paula and Toth Patricia
Bought by
Malguarnera Paula
Current Estimated Value
Purchase Details
Closed on
May 16, 2003
Sold by
Scognamiglio Joseph G and Scognamiglio Barbara A
Bought by
Koronkiewicz John
Home Financials for this Owner
Home Financials are based on the most recent Mortgage that was taken out on this home.
Original Mortgage
$258,400
Outstanding Balance
$112,142
Interest Rate
5.77%
Mortgage Type
Purchase Money Mortgage
Estimated Equity
$558,412
Create a Home Valuation Report for This Property
The Home Valuation Report is an in-depth analysis detailing your home's value as well as a comparison with similar homes in the area
Home Values in the Area
Average Home Value in this Area
Purchase History
| Date | Buyer | Sale Price | Title Company |
|---|---|---|---|
| Malguarnera Paula | -- | None Available | |
| Koronkiewicz John | $272,000 | -- |
Source: Public Records
Mortgage History
| Date | Status | Borrower | Loan Amount |
|---|---|---|---|
| Open | Koronkiewicz John | $258,400 |
Source: Public Records
Tax History
| Year | Tax Paid | Tax Assessment Tax Assessment Total Assessment is a certain percentage of the fair market value that is determined by local assessors to be the total taxable value of land and additions on the property. | Land | Improvement |
|---|---|---|---|---|
| 2024 | $9,411 | $2,700 | $300 | $2,400 |
| 2023 | $9,411 | $2,700 | $300 | $2,400 |
| 2022 | $8,356 | $2,700 | $300 | $2,400 |
| 2021 | $8,356 | $2,700 | $300 | $2,400 |
| 2020 | $8,661 | $2,700 | $300 | $2,400 |
| 2019 | $8,661 | $0 | $0 | $0 |
| 2018 | $8,179 | $2,700 | $300 | $2,400 |
| 2017 | $8,179 | $2,700 | $300 | $2,400 |
| 2016 | $8,835 | $2,900 | $300 | $2,600 |
| 2015 | -- | $2,700 | $300 | $2,400 |
| 2014 | -- | $2,700 | $300 | $2,400 |
Source: Public Records
Map
Nearby Homes
- 85 Bayview Ave
- 156 Clinton Ave
- 0 Bayview Ave
- 257 Union Ave
- 243 S Dunton Ave
- 3 Moss Creek Ln
- 225 Lyman Rd
- 149 Munsell Rd
- 281 Clinton Ave
- 12 Summit St
- 9 Golf Course Rd
- 214 Donegan Ave
- 22 Rod St
- 39 Roosevelt Blvd
- 2 Shore Rd
- 36 Roosevelt Blvd
- 16 Shore Rd
- 10 Kreamer St
- 24 S Howells Point Rd
- 84 Bieselin Rd
Your Personal Tour Guide
Ask me questions while you tour the home.