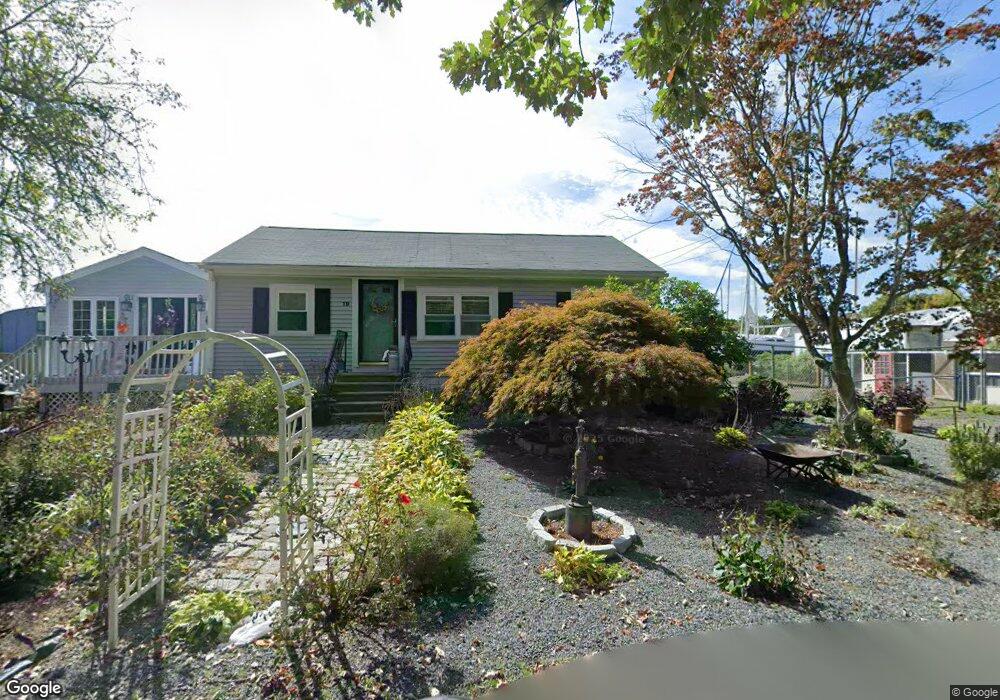
19 Cobbs Ln Dighton, MA 02715
Estimated Value: $414,795 - $483,000
3
Beds
1
Bath
1,500
Sq Ft
$297/Sq Ft
Est. Value
About This Home
This home is located at 19 Cobbs Ln, Dighton, MA 02715 and is currently estimated at $446,199, approximately $297 per square foot. 19 Cobbs Ln is a home located in Bristol County with nearby schools including Dighton-Rehoboth Regional High School.
Ownership History
Date
Name
Owned For
Owner Type
Purchase Details
Closed on
Oct 27, 1995
Sold by
Pontes Antero
Bought by
Esterla Aurelio N and Estrela Tammy M
Current Estimated Value
Home Financials for this Owner
Home Financials are based on the most recent Mortgage that was taken out on this home.
Original Mortgage
$99,000
Interest Rate
7.6%
Mortgage Type
Purchase Money Mortgage
Purchase Details
Closed on
Sep 15, 1989
Sold by
Taylor Carolyn J
Bought by
Pontes Antero
Create a Home Valuation Report for This Property
The Home Valuation Report is an in-depth analysis detailing your home's value as well as a comparison with similar homes in the area
Home Values in the Area
Average Home Value in this Area
Purchase History
| Date | Buyer | Sale Price | Title Company |
|---|---|---|---|
| Esterla Aurelio N | $105,000 | -- | |
| Pontes Antero | $108,000 | -- |
Source: Public Records
Mortgage History
| Date | Status | Borrower | Loan Amount |
|---|---|---|---|
| Open | Pontes Antero | $182,700 | |
| Closed | Pontes Antero | $99,000 | |
| Previous Owner | Pontes Antero | $87,000 |
Source: Public Records
Tax History
| Year | Tax Paid | Tax Assessment Tax Assessment Total Assessment is a certain percentage of the fair market value that is determined by local assessors to be the total taxable value of land and additions on the property. | Land | Improvement |
|---|---|---|---|---|
| 2025 | $3,946 | $314,200 | $117,200 | $197,000 |
| 2024 | $3,959 | $289,400 | $117,200 | $172,200 |
| 2023 | $3,792 | $272,000 | $117,200 | $154,800 |
| 2022 | $3,664 | $256,400 | $114,100 | $142,300 |
| 2021 | $5,517 | $233,500 | $103,000 | $130,500 |
| 2020 | $3,534 | $235,900 | $115,300 | $120,600 |
| 2019 | $0 | $222,400 | $115,300 | $107,100 |
| 2018 | $0 | $204,000 | $97,700 | $106,300 |
| 2017 | $0 | $201,600 | $113,800 | $87,800 |
| 2016 | $3,037 | $199,400 | $117,200 | $82,200 |
| 2015 | $2,924 | $197,600 | $120,600 | $77,000 |
| 2014 | $2,944 | $193,300 | $120,600 | $72,700 |
Source: Public Records
Map
Nearby Homes
- 1889 Elm St
- 31 Swing Dr
- 35 Water St
- 418 Hart St
- 2617 Pleasant St
- 7 Eric Dr
- 1064 Somerset Ave
- 2798 Elm St
- 729 Center St
- 1355 Pine St
- 1022 Rowland Dr
- 66 S Main St
- 7 Maris Ln
- 560 North St
- 989 Elm St
- 300 Country Hill Dr
- 75 Sanford St
- 3045 Clubhouse Dr Unit Lot 75
- R65 Clubhouse Dr Unit 65
- 74R Club House Dr Unit 74R
Your Personal Tour Guide
Ask me questions while you tour the home.