19 Corona St Springfield, MA 01104
Liberty Heights NeighborhoodEstimated Value: $284,000 - $317,000
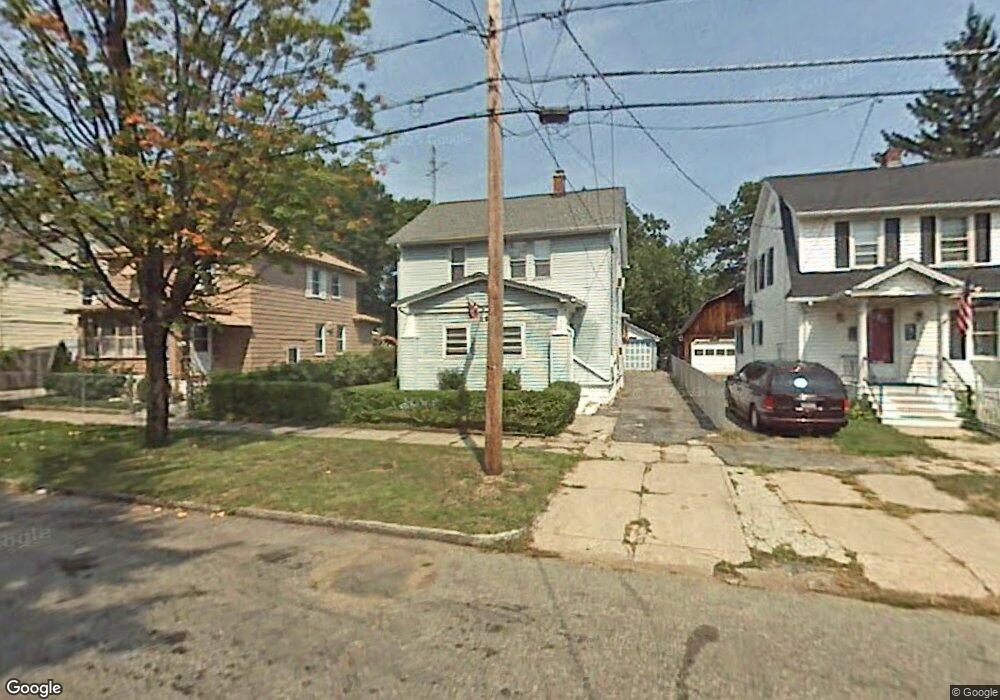
About This Home
This home is located at 19 Corona St, Springfield, MA 01104 and is currently estimated at $294,669, approximately $202 per square foot. 19 Corona St is a home located in Hampden County with nearby schools including Mary O. Pottenger Elementary School, Van Sickle Academy, and Springfield Central High School.
Ownership History
We collect this data history from publicly available records. To have your information removed, we recommend requesting removal directly through your county’s website.
Purchase Details
Home Values in the Area
Average Home Value in this Area
Purchase History
We collect this data history from publicly available records. To have your information removed, we recommend requesting removal directly through your county’s website.
| Date | Buyer | Sale Price | Title Company |
|---|---|---|---|
| $81,400 | -- |
Mortgage History
We collect this data history from publicly available records. To have your information removed, we recommend requesting removal directly through your county’s website.
| Date | Status | Borrower | Loan Amount |
|---|---|---|---|
| Open | $118,146 | ||
| Closed | $27,000 | ||
| Closed | $68,000 |
Tax History
We collect this data history from publicly available records. To have your information removed, we recommend requesting removal directly through your county’s website.
| Year | Tax Paid | Tax Assessment Tax Assessment Total Assessment is a certain percentage of the fair market value that is determined by local assessors to be the total taxable value of land and additions on the property. | Land | Improvement |
|---|---|---|---|---|
| 2025 | $3,878 | $247,300 | $39,300 | $208,000 |
| 2024 | $3,501 | $218,000 | $39,300 | $178,700 |
| 2023 | $3,589 | $210,500 | $34,800 | $175,700 |
| 2022 | $3,149 | $167,300 | $32,500 | $134,800 |
| 2021 | $3,045 | $161,100 | $29,600 | $131,500 |
| 2020 | $2,924 | $149,700 | $29,600 | $120,100 |
| 2019 | $2,887 | $146,700 | $32,200 | $114,500 |
| 2018 | $2,797 | $142,100 | $32,200 | $109,900 |
| 2017 | $2,796 | $142,200 | $29,100 | $113,100 |
| 2016 | $2,733 | $139,000 | $27,600 | $111,400 |
| 2015 | $2,598 | $132,100 | $27,600 | $104,500 |
Map
- 15 Merida St
- 49 Corona St
- 884-886 Saint James Ave
- 63 Fordham St
- 68 San Miguel St
- 25 Victoria St
- 102 San Miguel St
- 210 Naismith St
- 40 Ames St Unit 42
- 278-280 Page Blvd
- 257 Redlands St
- 0 Nottingham St (Ws) Unit 73538589
- 35 Merrimac Ave
- 32-34 Santa Barbara St
- 15-17 Santa Barbara St
- 43 Barton St
- 44-46 Middle St
- 154 Russell St
- 40 W Canton Cir
- 4 Wolfe St
Ask me questions while you tour the home.