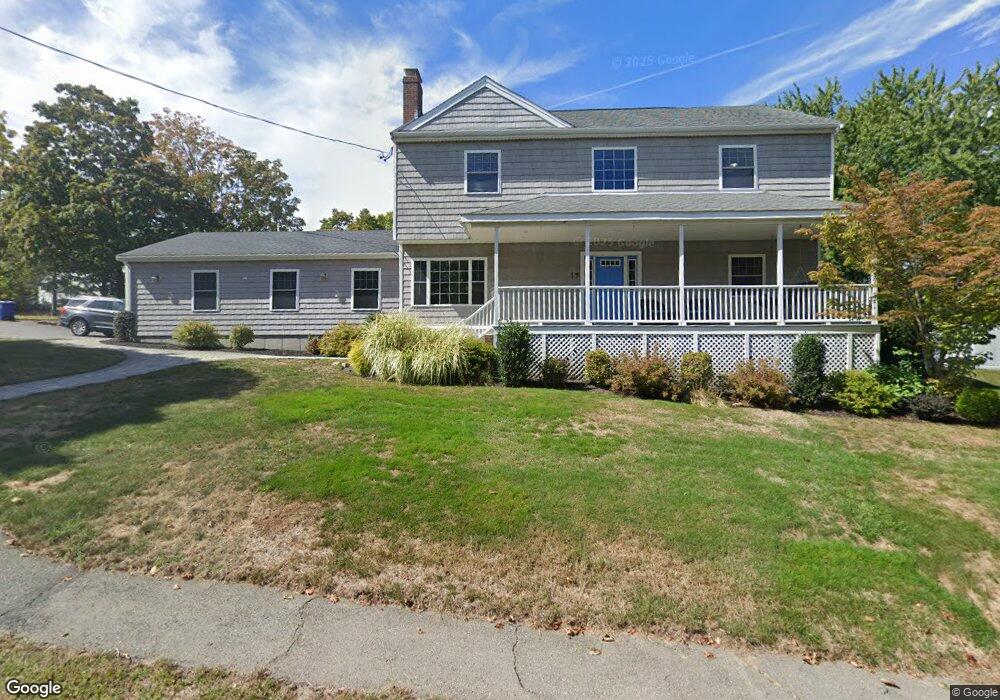
19 Fallon Cir Braintree, MA 02184
North Braintree NeighborhoodEstimated Value: $802,000 - $1,032,000
4
Beds
3
Baths
3,076
Sq Ft
$316/Sq Ft
Est. Value
About This Home
This home is located at 19 Fallon Cir, Braintree, MA 02184 and is currently estimated at $973,199, approximately $316 per square foot. 19 Fallon Cir is a home located in Norfolk County with nearby schools including Braintree High School, Step Ahead Kindergarten, and Meeting House Montessori School.
Ownership History
Date
Name
Owned For
Owner Type
Purchase Details
Closed on
Jan 9, 2024
Sold by
Parsons Robert J and Parsons Gail R
Bought by
Parson Rt and Parsons
Current Estimated Value
Purchase Details
Closed on
Oct 18, 2004
Sold by
Parsons Frances J and Parsons Richard G
Bought by
Parsons Gail R and Parsons Robert J
Home Financials for this Owner
Home Financials are based on the most recent Mortgage that was taken out on this home.
Original Mortgage
$296,000
Interest Rate
5.8%
Mortgage Type
Purchase Money Mortgage
Create a Home Valuation Report for This Property
The Home Valuation Report is an in-depth analysis detailing your home's value as well as a comparison with similar homes in the area
Home Values in the Area
Average Home Value in this Area
Purchase History
| Date | Buyer | Sale Price | Title Company |
|---|---|---|---|
| Parson Rt | -- | None Available | |
| Parsons Gail R | $370,002 | -- |
Source: Public Records
Mortgage History
| Date | Status | Borrower | Loan Amount |
|---|---|---|---|
| Previous Owner | Parsons Gail R | $296,000 |
Source: Public Records
Tax History
| Year | Tax Paid | Tax Assessment Tax Assessment Total Assessment is a certain percentage of the fair market value that is determined by local assessors to be the total taxable value of land and additions on the property. | Land | Improvement |
|---|---|---|---|---|
| 2025 | $8,484 | $850,100 | $379,700 | $470,400 |
| 2024 | $7,899 | $833,200 | $379,700 | $453,500 |
| 2023 | $7,446 | $762,900 | $333,600 | $429,300 |
| 2022 | $7,248 | $728,400 | $299,100 | $429,300 |
| 2021 | $6,779 | $681,300 | $276,100 | $405,200 |
| 2020 | $6,377 | $646,800 | $241,600 | $405,200 |
| 2019 | $5,857 | $580,500 | $218,600 | $361,900 |
| 2018 | $5,660 | $537,000 | $195,600 | $341,400 |
| 2017 | $5,488 | $511,000 | $184,100 | $326,900 |
| 2016 | $5,273 | $480,200 | $172,600 | $307,600 |
| 2015 | $5,105 | $461,200 | $165,700 | $295,500 |
| 2014 | $4,835 | $423,400 | $149,600 | $273,800 |
Source: Public Records
Map
Nearby Homes
- 15 Calvin St
- 7 Del's Way
- 20 Blossom Rd
- 87 Walnut St
- 18 Royal Lake Dr Unit 3
- 63 Dickerman Ln
- 491 Washington St Unit 1
- 469-471 Washington St
- 632 Washington St Unit G5
- 5 Woodsum Dr Unit 12
- 6 Franklin St
- 6 Lunar Ave
- 80 Lake St
- 9 Independence Ave Unit 102
- 11 Oak Grove Terrace Unit 301
- 260 West St Unit 7
- 21 Barstow Dr
- 21 Totman St Unit 205
- 21 Totman St Unit 409
- 21 Totman St Unit 203
Your Personal Tour Guide
Ask me questions while you tour the home.