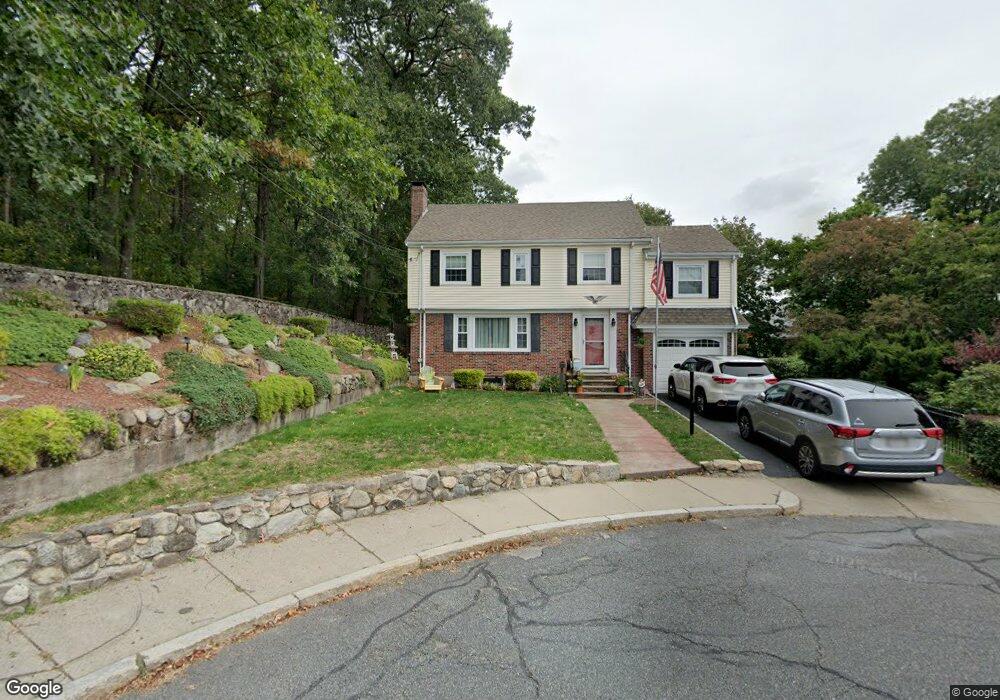
19 Lantern Ln West Roxbury, MA 02132
West Roxbury NeighborhoodEstimated Value: $758,000 - $1,199,000
4
Beds
3
Baths
2,071
Sq Ft
$480/Sq Ft
Est. Value
About This Home
This home is located at 19 Lantern Ln, West Roxbury, MA 02132 and is currently estimated at $993,941, approximately $479 per square foot. 19 Lantern Ln is a home located in Suffolk County with nearby schools including Brooke Charter School Roslindale, Holy Name Parish School, and St Theresa School.
Ownership History
Date
Name
Owned For
Owner Type
Purchase Details
Closed on
Apr 21, 1989
Sold by
Keefe Theresa V
Bought by
Antoniazzi Gregory C
Current Estimated Value
Home Financials for this Owner
Home Financials are based on the most recent Mortgage that was taken out on this home.
Original Mortgage
$115,000
Interest Rate
10.79%
Mortgage Type
Purchase Money Mortgage
Create a Home Valuation Report for This Property
The Home Valuation Report is an in-depth analysis detailing your home's value as well as a comparison with similar homes in the area
Home Values in the Area
Average Home Value in this Area
Purchase History
| Date | Buyer | Sale Price | Title Company |
|---|---|---|---|
| Antoniazzi Gregory C | $230,000 | -- |
Source: Public Records
Mortgage History
| Date | Status | Borrower | Loan Amount |
|---|---|---|---|
| Open | Antoniazzi Gregory C | $230,000 | |
| Closed | Antoniazzi Gregory C | $21,000 | |
| Closed | Antoniazzi Gregory C | $116,000 | |
| Closed | Antoniazzi Gregory C | $115,000 |
Source: Public Records
Tax History
| Year | Tax Paid | Tax Assessment Tax Assessment Total Assessment is a certain percentage of the fair market value that is determined by local assessors to be the total taxable value of land and additions on the property. | Land | Improvement |
|---|---|---|---|---|
| 2025 | $9,635 | $832,000 | $300,300 | $531,700 |
| 2024 | $9,438 | $865,900 | $309,400 | $556,500 |
| 2023 | $8,854 | $824,400 | $294,600 | $529,800 |
| 2022 | $8,226 | $756,100 | $270,200 | $485,900 |
| 2021 | $7,641 | $716,100 | $259,800 | $456,300 |
| 2020 | $7,186 | $680,500 | $234,800 | $445,700 |
| 2019 | $6,767 | $642,000 | $197,100 | $444,900 |
| 2018 | $6,409 | $611,500 | $197,100 | $414,400 |
| 2017 | $6,410 | $605,300 | $197,100 | $408,200 |
| 2016 | $6,223 | $565,700 | $197,100 | $368,600 |
| 2015 | $6,413 | $529,600 | $197,500 | $332,100 |
| 2014 | $6,163 | $489,900 | $197,500 | $292,400 |
Source: Public Records
Map
Nearby Homes
- 33 Morey Rd
- 111 Montclair Ave
- 141 Church St
- 390 Weld St Unit 2
- 25 Clearwater Rd
- 74 Bradfield Ave
- 87 Bonad Rd
- 214 Allandale Rd Unit B
- 214 Allandale Rd Unit D
- 0 Vfw Pkwy Unit 73491016
- 202 Allandale Rd Unit B
- 1721 Centre St Unit 402
- 1721 Centre St Unit 304
- 303 Russett Rd
- 55 Redlands Rd
- 72 Redlands Rd
- 188 Maple St
- 16 Primrose St Unit 3
- 15 S Fairview St Unit 3
- 18 Robert St Unit 14
Your Personal Tour Guide
Ask me questions while you tour the home.