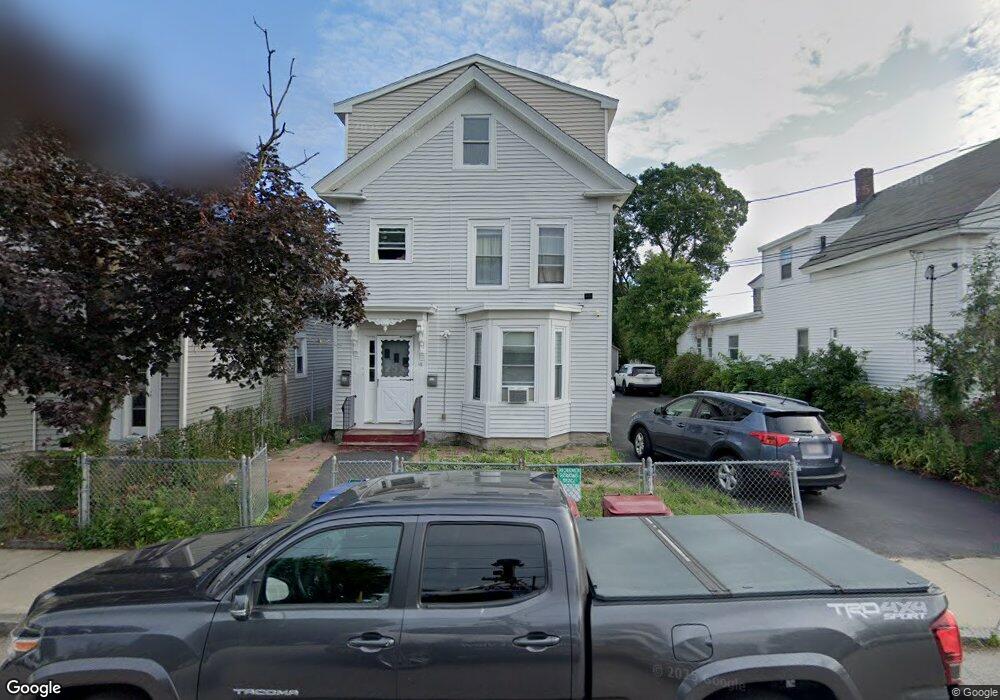
19 Leroy St Lowell, MA 01851
Lower Highlands NeighborhoodEstimated Value: $614,000 - $739,000
About This Home
This home is located at 19 Leroy St, Lowell, MA 01851 and is currently estimated at $691,122, approximately $223 per square foot. 19 Leroy St is a home located in Middlesex County with nearby schools including Charles W. Morey Elementary School, Abraham Lincoln Elementary School, and Charlotte M. Murkland Elementary School.
Ownership History
We collect this data history from publicly available records. To have your information removed, we recommend requesting removal directly through your county’s website.
Purchase Details
Home Financials for this Owner
Home Financials are based on the most recent Mortgage that was taken out on this home.Purchase Details
Home Values in the Area
Average Home Value in this Area
Purchase History
We collect this data history from publicly available records. To have your information removed, we recommend requesting removal directly through your county’s website.
| Date | Buyer | Sale Price | Title Company |
|---|---|---|---|
| $165,000 | -- | ||
| $165,000 | -- | ||
| $130,000 | -- | ||
| $130,000 | -- |
Mortgage History
We collect this data history from publicly available records. To have your information removed, we recommend requesting removal directly through your county’s website.
| Date | Status | Borrower | Loan Amount |
|---|---|---|---|
| Open | $274,300 | ||
| Closed | $274,300 |
Tax History
We collect this data history from publicly available records. To have your information removed, we recommend requesting removal directly through your county’s website.
| Year | Tax Paid | Tax Assessment Tax Assessment Total Assessment is a certain percentage of the fair market value that is determined by local assessors to be the total taxable value of land and additions on the property. | Land | Improvement |
|---|---|---|---|---|
| 2025 | $7,515 | $654,600 | $161,400 | $493,200 |
| 2024 | $6,922 | $581,200 | $145,300 | $435,900 |
| 2023 | $6,436 | $518,200 | $126,300 | $391,900 |
| 2022 | $5,955 | $469,300 | $114,800 | $354,500 |
| 2021 | $5,523 | $410,300 | $99,900 | $310,400 |
| 2020 | $4,990 | $373,500 | $87,300 | $286,200 |
| 2019 | $4,580 | $326,200 | $80,800 | $245,400 |
| 2018 | $4,222 | $293,400 | $73,600 | $219,800 |
| 2017 | $3,708 | $248,500 | $66,900 | $181,600 |
| 2016 | $3,719 | $245,300 | $63,700 | $181,600 |
| 2015 | $2,819 | $182,100 | $65,200 | $116,900 |
| 2013 | $3,197 | $213,000 | $78,000 | $135,000 |
Map
- 110 Branch St Unit 2
- 68 Dover St Unit 6
- 1036 Middlesex St Unit 9
- 1045 Middlesex St
- 312 Wilder St
- 654 School St
- 446 Westford St Unit 1
- 118 Smith St Unit 3
- 67 S Loring St
- 18 Burgess St
- 137 Pine St Unit 29
- 79 Warwick St
- 710 School St
- 68 Liberty St
- 1159 Middlesex St
- 78 Stevens St
- 252 Shaw St
- 54 Gates St Unit 2
- 122 S Walker St
- 99 Westford St
Ask me questions while you tour the home.