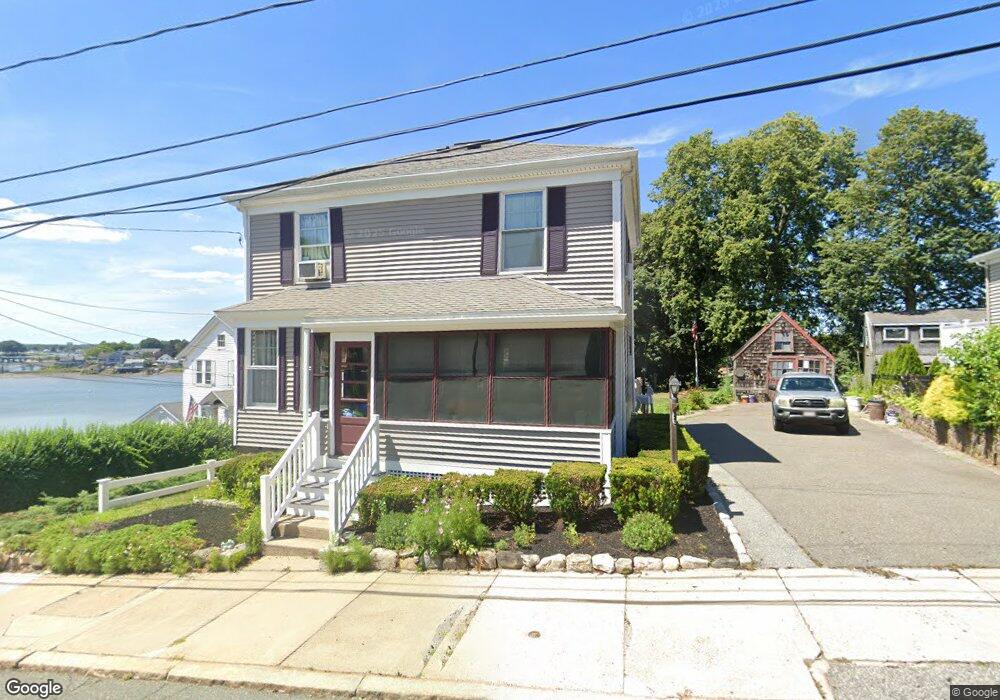
19 Linden Ave Beverly, MA 01915
Downtown Beverly NeighborhoodEstimated Value: $612,000 - $701,000
3
Beds
2
Baths
1,427
Sq Ft
$472/Sq Ft
Est. Value
About This Home
This home is located at 19 Linden Ave, Beverly, MA 01915 and is currently estimated at $673,163, approximately $471 per square foot. 19 Linden Ave is a home located in Essex County with nearby schools including Beverly High School, Salem Academy Charter School, and Mrs Alexander's School.
Ownership History
Date
Name
Owned For
Owner Type
Purchase Details
Closed on
Feb 17, 2017
Sold by
Acciavatti Ft and Acciavatti
Bought by
Mjp Properties Inc
Current Estimated Value
Home Financials for this Owner
Home Financials are based on the most recent Mortgage that was taken out on this home.
Original Mortgage
$1,366,000
Outstanding Balance
$1,114,519
Interest Rate
4.2%
Mortgage Type
Amount Keyed Is An Aggregate Amount
Estimated Equity
-$441,356
Purchase Details
Closed on
Dec 1, 2010
Sold by
Acciavatti Richard and Acciavatti Paula M
Bought by
Acciavatti Ft and Acciavatti
Create a Home Valuation Report for This Property
The Home Valuation Report is an in-depth analysis detailing your home's value as well as a comparison with similar homes in the area
Home Values in the Area
Average Home Value in this Area
Purchase History
| Date | Buyer | Sale Price | Title Company |
|---|---|---|---|
| Mjp Properties Inc | $185,000 | -- | |
| Acciavatti Ft | -- | -- |
Source: Public Records
Mortgage History
| Date | Status | Borrower | Loan Amount |
|---|---|---|---|
| Open | Mjp Properties Inc | $1,366,000 |
Source: Public Records
Tax History
| Year | Tax Paid | Tax Assessment Tax Assessment Total Assessment is a certain percentage of the fair market value that is determined by local assessors to be the total taxable value of land and additions on the property. | Land | Improvement |
|---|---|---|---|---|
| 2025 | $6,552 | $596,200 | $386,900 | $209,300 |
| 2024 | $6,207 | $552,700 | $343,400 | $209,300 |
| 2023 | $6,027 | $535,300 | $326,000 | $209,300 |
| 2022 | $6,092 | $500,600 | $291,300 | $209,300 |
| 2021 | $6,097 | $480,100 | $291,300 | $188,800 |
| 2020 | $5,880 | $458,300 | $269,500 | $188,800 |
| 2019 | $5,720 | $433,000 | $250,000 | $183,000 |
| 2018 | $5,675 | $417,300 | $250,000 | $167,300 |
| 2017 | $5,061 | $354,400 | $187,100 | $167,300 |
| 2016 | $5,100 | $354,400 | $187,100 | $167,300 |
| 2015 | $5,001 | $354,400 | $187,100 | $167,300 |
Source: Public Records
Map
Nearby Homes
- 12 Summit Ave Unit 6
- 18-20 Front St Unit 3
- 60 Rantoul St Unit 708N
- 60 Rantoul St Unit 114N
- 57 Front St Unit 2
- 109 Water St Unit 404
- 36 Stone St
- 115 Water St Unit 14
- 114 Livingstone Ave
- 9 Parkview Ave
- 6 Pearl St
- 11 Barton St
- 60 Orne St
- 16 Pleasant St
- 6 Hayes Ave
- 5 Beckford St Unit 3
- 19 Appleton St
- 146 North St Unit 4
- 21 Goldsmith Ave
- 16 Franklin St Unit 1303
Your Personal Tour Guide
Ask me questions while you tour the home.