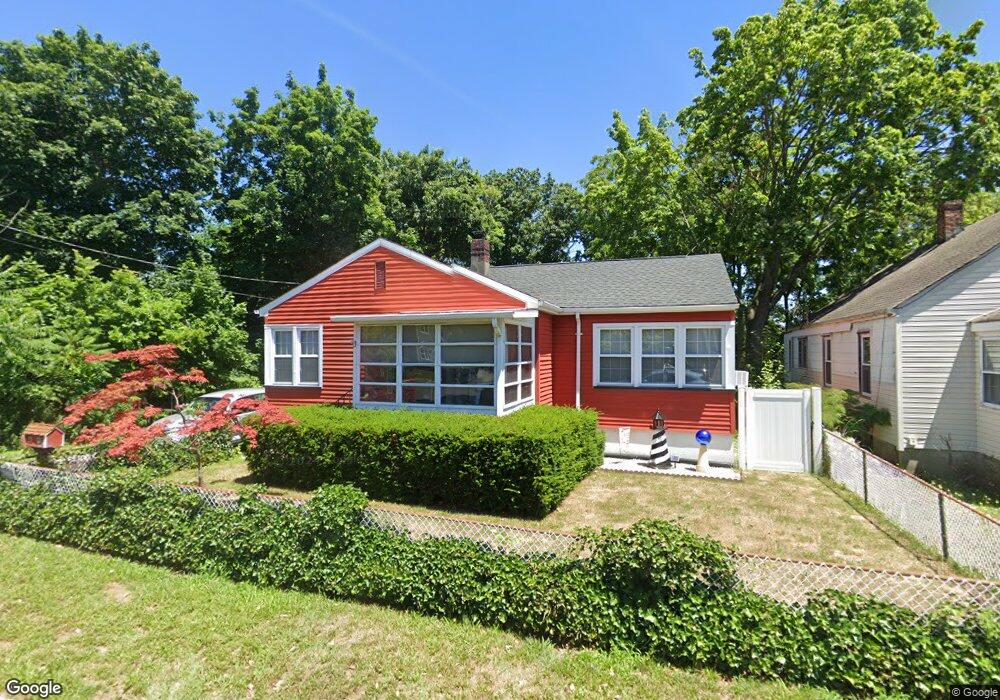
19 May St Keyport, NJ 07735
Estimated Value: $407,407 - $435,000
About This Home
This home is located at 19 May St, Keyport, NJ 07735 and is currently estimated at $419,602, approximately $392 per square foot. 19 May St is a home located in Monmouth County with nearby schools including Keyport Central School, Keyport High School, and St. Joseph Elementary School.
Ownership History
We collect this data history from publicly available records. To have your information removed, we recommend requesting removal directly through your county’s website.
Purchase Details
Home Financials for this Owner
Home Financials are based on the most recent Mortgage that was taken out on this home.Home Values in the Area
Average Home Value in this Area
Purchase History
We collect this data history from publicly available records. To have your information removed, we recommend requesting removal directly through your county’s website.
| Date | Buyer | Sale Price | Title Company |
|---|---|---|---|
| $129,500 | -- |
Mortgage History
We collect this data history from publicly available records. To have your information removed, we recommend requesting removal directly through your county’s website.
| Date | Status | Borrower | Loan Amount |
|---|---|---|---|
| Open | $116,550 |
Tax History
We collect this data history from publicly available records. To have your information removed, we recommend requesting removal directly through your county’s website.
| Year | Tax Paid | Tax Assessment Tax Assessment Total Assessment is a certain percentage of the fair market value that is determined by local assessors to be the total taxable value of land and additions on the property. | Land | Improvement |
|---|---|---|---|---|
| 2025 | $6,754 | $366,700 | $177,300 | $189,400 |
| 2024 | $6,530 | $326,300 | $146,200 | $180,100 |
| 2023 | $6,530 | $297,100 | $127,100 | $170,000 |
| 2022 | $5,389 | $258,400 | $110,600 | $147,800 |
| 2021 | $5,389 | $213,500 | $102,400 | $111,100 |
| 2020 | $5,195 | $204,300 | $98,700 | $105,600 |
| 2019 | $5,037 | $198,400 | $95,200 | $103,200 |
| 2018 | $4,792 | $184,300 | $87,700 | $96,600 |
| 2017 | $4,839 | $185,600 | $90,200 | $95,400 |
| 2016 | $4,625 | $178,900 | $90,200 | $88,700 |
| 2015 | $4,488 | $172,800 | $85,200 | $87,600 |
| 2014 | $4,421 | $171,900 | $60,200 | $111,700 |
Map
- 335 Maple Place
- 285 Washington St
- 316 Broadway
- 52 Highway 35
- 191 Chingarora Ave
- 106 Chingarora Ave
- 143 Luppatatong Ave
- 55 Lower Main St
- 39 Wooley St
- 95 Broadway
- 2 Chingarora Ave
- 1 Luppatatong Ave
- 101 Perry St
- 23 Mathiasen Place
- 14 Dolan Ave
- 44 Beers St Unit A
- 23 Coral Dr
- 402 W Prospect Ave
- 3 Harrison Ave
- 9 Kearney St
Ask me questions while you tour the home.